
Liquidity pools in forex are the areas on a chart where money is waiting to be collected. Not in some vague, theoretical sense. Literally waiting, in the form of stop losses and pending orders placed by retail traders at predictable levels. Banks and institutions know exactly where those orders sit, because retail traders are consistent. They protect their longs below recent lows. They protect their shorts above recent highs. They place breakout entries just beyond established ranges. Over time, those orders pile up at the same kinds of levels, and that accumulation is what creates a liquidity pool.
Understanding liquidity pools is not just one concept you learn and move on from. It is the foundation that connects everything else in Smart Money Concepts: why grabs happen, why sweeps happen, why price moves from one level to the next, and how the External Range Liquidity to Internal Range Liquidity cycle works across every timeframe. If you want to trade with institutions rather than against them, this is where that understanding starts.
What Is a Liquidity Pool in Forex?
A liquidity pool in forex is an area on a chart where a significant concentration of buy or sell orders has accumulated. These orders come in two main forms: stop losses that traders have placed to limit their losses if price moves against them, and pending orders that traders have placed to enter a position when price reaches a specific level.
The key point is that these orders do not disappear once they are placed. They sit there, resting at specific price levels, until price reaches them and triggers them. Because retail traders follow predictable patterns when placing these orders, the areas where they accumulate are readable in advance. A previous swing high almost always has buy stop orders sitting just above it. A previous swing low almost always has sell stop orders sitting just below it. That predictability is exactly what institutions rely on.
For large institutions trading hundreds of millions in a single position, these pools are not just interesting chart features. They are necessary. A bank cannot fill a position of that size without a counterparty on the other side of the trade. Retail stop losses and pending orders provide that counterparty. When a bank wants to sell a large position, it drives price into an area of buy stops above a high and uses those orders as the liquidity to fill its sell. The retail traders whose stop losses triggered at that high become the other side of the institutional trade.
That is the honest reality of what a liquidity pool is and why it matters. It is where the money is, and price always comes for it eventually.
Why Liquidity Pools Form: The Institutional Logic
Liquidity pools form because retail traders are consistent in how they protect their positions. That consistency is not a flaw in most traders’ thinking. It follows logical risk management principles. The problem is that when everyone follows the same logic, everyone places their orders at the same levels. And when orders cluster at the same levels, institutions can see where the fuel is.
Stop loss clustering is the primary driver. A retail trader who goes long on a breakout above a previous high will typically place their stop just below that high or below the most recent swing low. A retail trader who goes short at a key resistance level will place their stop just above that resistance. Across thousands of traders making similar decisions, those stop levels align closely enough to create a meaningful pool of orders at predictable locations.
Pending order clustering adds to the same pools from a different angle. Breakout traders place buy orders above recent highs expecting continuation. They place sell orders below recent lows for the same reason. These orders sit at the same levels as the stop losses of traders positioned in the opposite direction. The result is that both sides of the market contribute to the same pools, just from different positions.
Psychological levels attract orders because round numbers and obvious chart levels are where most traders naturally anchor their thinking. A level like 1.2000 on EUR/USD or 150.00 on USD/JPY will draw more orders than a less obvious level because traders gravitate toward clean numbers when deciding where to place stops and entries.
For a deeper understanding of how institutions approach and exploit liquidity across different market structures, the GhostTraders guide on what liquidity is in trading covers the foundational mechanics that drive every concept in this article.
Buy Side Liquidity (BSL) vs Sell Side Liquidity (SSL)
Every liquidity pool belongs to one of two categories, and knowing which category a pool belongs to tells you immediately how institutions will use it and what direction the resulting move will take.
Buy Side Liquidity (BSL)
BSL pools sit above key highs on a chart. They contain two types of orders. Short sellers have their stop losses positioned above those highs to cap their losses if price moves against them. Breakout buyers have their pending orders above those highs expecting an upward continuation. When price drives above a BSL pool and collects those orders, it is using the buying pressure generated by all those triggered orders to sell into. The result is that a spike above BSL is a bearish signal. Price reached above the high not to continue higher but to collect the fuel needed for the downward move.
Sell Side Liquidity (SSL)
SSL pools sit below key lows. Long traders have stop losses below those lows to protect their positions. Breakout sellers have pending sell orders below expecting a downward continuation. When price drives below an SSL pool, it triggers all of those sell orders and uses the resulting selling pressure as the fuel to buy. A spike below SSL is therefore a bullish signal. The institution swept below the low to collect the sell orders it needed to fill its long position.
The core principle to internalise is this: BSL above gets collected to move price down. SSL below gets collected to move price up. This is the direct opposite of what breakout trading teaches, and it is why so many retail breakout traders get stopped out right at the point where they entered.
The Eight Types of Liquidity Pools on Your Chart
Not all pools carry equal weight. The most reliable ones share a common characteristic: they are obvious to the majority of traders looking at the same chart, which means more orders have accumulated there. Here are the eight pool types that appear consistently across every market and timeframe.
1. Previous Day High and Low (PDH and PDL)
The previous trading session’s high and low are among the most actively referenced levels by intraday traders worldwide. Stop losses cluster just beyond both levels. During the London and New York sessions, these levels are frequent targets for pool collection before the actual directional move establishes itself. A spike above the PDH followed by a close back below it is a textbook bearish pool collection. A spike below the PDL followed by a close back above it is a textbook bullish pool collection.
2. Previous Week High and Low (PWH and PWL)
Weekly highs and lows carry more institutional weight than daily levels because they represent longer-term structural reference points. Fund managers and swing traders reference these levels for position management, which means larger stop orders accumulate there. A sweep or grab of a PWH or PWL frequently precedes a multi-day directional move in the opposite direction.
3. Previous Month High and Low (PMH and PML)
Monthly highs and lows are macro liquidity targets. Sweeping a monthly high or low signals major institutional repositioning and often precedes significant trend changes. These are the levels to watch when building a monthly directional bias.
4. Swing Highs and Swing Lows
Any clearly defined point where price made a high followed by lower prices, or a low followed by higher prices, accumulates liquidity. The more prominent the swing point relative to surrounding price action, the larger the pool sitting above or below it. Prominent swing highs are BSL pools. Prominent swing lows are SSL pools.
5. Equal Highs and Equal Lows
When price tests the same high or low twice or more without breaking it, the pool at that level grows with every failed test. Each test adds more stop losses from traders who went short at the resistance or long at the support, and more breakout orders from traders waiting for the eventual break. Equal highs are among the most targeted BSL pools on any chart. Equal lows are among the most targeted SSL pools. The more times price touches a level without breaking it, the more orders accumulate there, and the more aggressively institutions will eventually collect from that pool.
6. Consolidation Range Extremes
When price moves sideways in a defined range, both BSL and SSL accumulate at the upper and lower boundaries. The upper extreme has buy stops from breakout buyers and stop losses from traders who shorted the range. The lower extreme has sell stops from traders long the range and breakout sell orders from traders expecting a downward break. Both extremes are liquidity pools that will eventually be collected before the market makes its directional move.
7. Trend Line Stops
Traders who use trend lines to manage positions typically place stop losses just beyond those trend lines. As price approaches a trend line, the orders behind it build up. When price eventually breaks the trend line, it is frequently collecting those orders rather than signalling a genuine directional change. This is why so many trend line breakouts fail immediately after the break.
8. Round Number and Psychological Levels
Round numbers attract orders from retail traders because they are cognitively easy to anchor to. Levels ending in 00, 50, or other clean numbers consistently accumulate more orders than adjacent levels. The 1.2000 level on EUR/USD will always have more orders sitting around it than 1.2017, for example. Institutions are aware of this and use these levels as pool collection targets.
How Liquidity Pools Connect to Grabs and Sweeps
Liquidity pools are where the orders sit. Grabs and sweeps are the two ways institutions collect those orders. Understanding all three concepts together gives you a complete picture of how price moves around liquidity.
A liquidity grab is the fast version of pool collection. Price spikes aggressively through a pool level, triggers the orders there, and closes back inside the prior range within a single candle. The result is a long-wick candle at the pool level. A bullish grab at an SSL pool produces a long lower wick. A bearish grab at a BSL pool produces a long upper wick. The candle closes back inside the range and the reversal begins.
A liquidity sweep is the slower version. Price moves through the pool level and may consolidate briefly beyond it before reversing back inside. The collection of orders at the pool still occurs, but it unfolds over multiple candles rather than a single spike. The confirmation comes when price closes back inside the range after spending time beyond the pool level.
Both are ways of answering the same question: how does price access the orders sitting at a specific pool? The grab answers it in one aggressive candle. The sweep takes its time. For a full breakdown of how to trade each, the GhostTraders guides on liquidity grabs and liquidity sweeps cover the complete step-by-step approach for both.
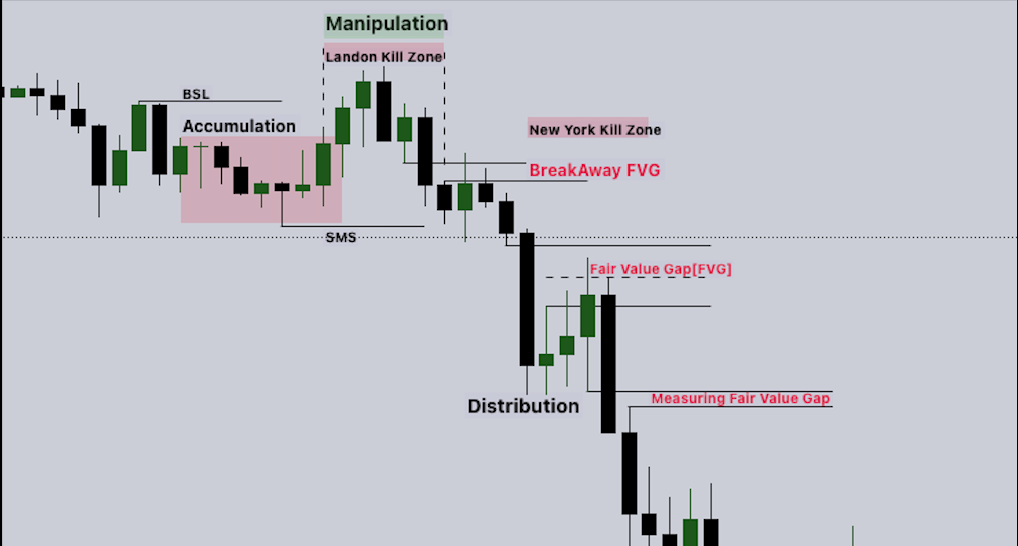
Liquidity Pools and the ERL to IRL Cycle
This is the framework that ties everything together and explains not just where pools are, but where price is going after a pool gets collected.
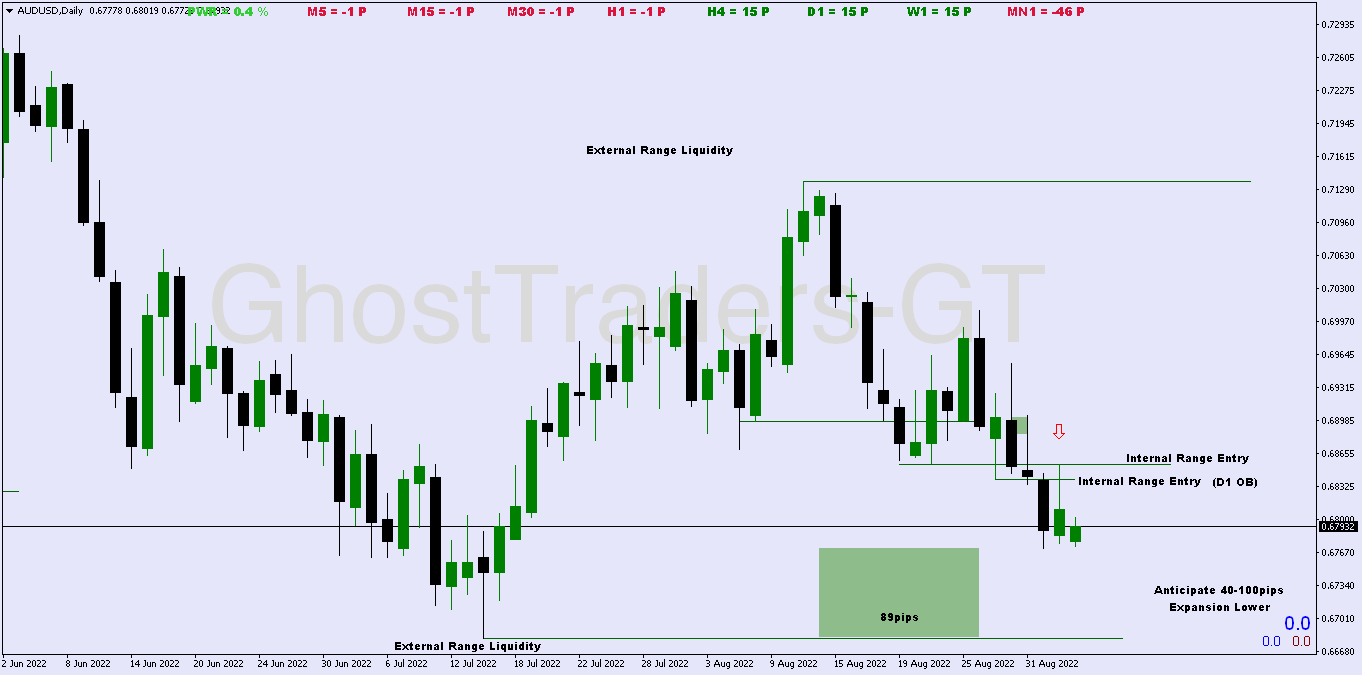
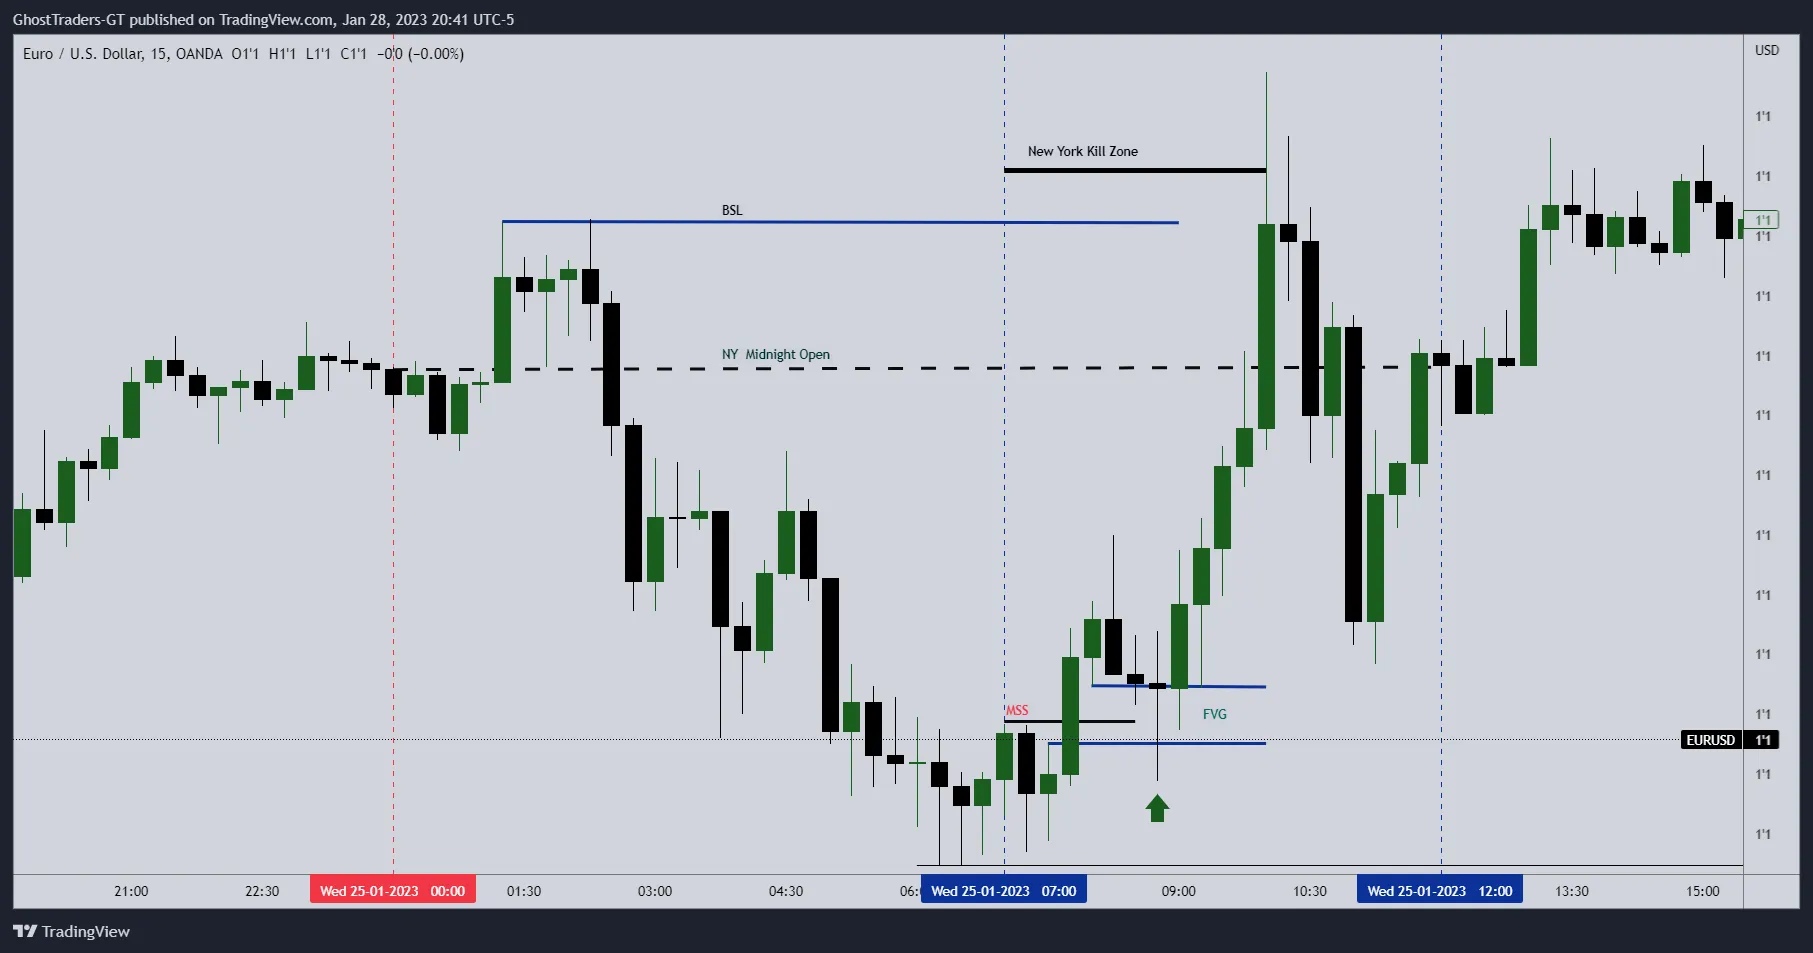
External Range Liquidity (ERL) is the liquidity sitting at the boundaries of a defined price range. In practice, this is your BSL above the range high and your SSL below the range low. These are the liquidity pools that price is eventually drawn to collect before reversing or continuing. ERL is the destination.
Internal Range Liquidity (IRL) is the liquidity sitting inside the range. This takes the form of Fair Value Gaps (FVGs) and order blocks rather than BSL or SSL pools. After ERL is collected at a pool level, price does not simply reverse and move randomly. It draws toward the next IRL target, specifically the FVG created by the impulse move that collected the pool. That FVG becomes the entry point for the trade.
The cycle in practice works like this. Price collects SSL at a swing low pool (ERL taken to the downside). The aggressive move that collected the pool creates a bullish FVG on the way back up (IRL formed). Price retraces into that FVG (draw toward IRL). Price finds support at the FVG and resumes higher toward the BSL pool above the range (ERL to the upside). That BSL pool gets collected (ERL taken to the upside). A bearish FVG forms on the way back down (IRL formed again). The cycle continues.
This framework tells you two things before you ever place a trade. First, which pool is likely to be collected next based on where you are in the cycle. Second, exactly where to enter after the collection happens. You are not guessing. You are reading the rotation that price is already executing.
For the complete explanation of how to define your range, identify ERL and IRL, and use the cycle to build daily bias, the GhostTraders guide on External and Internal Range Liquidity walks through the full methodology with examples across multiple timeframes.

How to Identify Liquidity Pools on a Chart
The good news is that you do not need a special indicator to find liquidity pools. They are visible on any clean price chart once you know what you are looking for. Here is the process.
Step 1: Define your working range. Choose your trading timeframe and identify the most recent significant swing high and swing low. These form the boundaries of your range. BSL sits above the swing high. SSL sits below the swing low.
Step 2: Mark obvious structural levels. Draw horizontal lines at the previous day high and low, the previous week high and low, and any prominent swing highs and lows visible on the chart. These are your primary pool locations.
Step 3: Look for equal highs and equal lows. Scan for levels where price has tested the same high or low multiple times. These are your highest-priority targets because orders there have been accumulating across multiple tests.
Step 4: Note consolidation extremes. If there is a visible range on the chart where price has been moving sideways, mark the upper and lower boundaries. Both extremes are active pools.
Step 5: Assess pool significance. Not every pool is worth trading. Prioritise pools that are obvious to the majority of traders. The more visible a level is on a standard chart, the more orders have accumulated there, and the higher-probability the collection event will be.
Step 6: Wait for the approach. Once your pools are marked, watch for price to move toward them. The approach itself often shows directional intent. A slow grind toward a BSL pool followed by an aggressive spike and reversal is the typical pattern for institutional collection.
How to Trade Liquidity Pools Step by Step
Step 1: Set Your Higher-Timeframe Bias
Before looking at any specific pool setup, establish the dominant order flow direction on the daily or 4-hour chart. Is price in a structure of higher highs and higher lows? Is it in a structure of lower highs and lower lows? This tells you which pools are more likely to be targeted next and in which direction to trade after collection.
Step 2: Identify the Nearest Uncollected Pool
With your bias set, find the nearest uncollected pool in the direction that fits the cycle. If the daily structure is bullish and price is pulling back, look for the nearest SSL pool below recent price where a collection event could trigger the next upward move.
Step 3: Wait for the Collection
Let price come to the pool. Do not anticipate or chase. When price reaches the pool level, watch for either a grab (single-candle spike with a close back inside) or a sweep (multi-candle extension beyond the level that then closes back inside). The close back inside the range is the first confirmation that the collection is complete.
Step 4: Confirm the Reversal on a Lower Timeframe
Drop to a timeframe one or two levels below your working chart. After an SSL collection on the 4-hour, go to the 1-hour. Look for a Change of Character (CHoCH), which is a break of a short-term structural point in the direction of your bias. After a bullish pool collection, the CHoCH is price breaking above a short-term lower high. This confirms the reversal is real rather than just a temporary pause.
Step 5: Enter at the Fair Value Gap
The aggressive move that collected the pool almost always creates a Fair Value Gap. This is your Internal Range Liquidity and your entry zone. Set a limit order at the FVG, specifically at the Consequent Encroachment level (the 50% midpoint of the gap) for the tightest possible stop and the best risk-to-reward.
Step 6: Place Your Stop and Set Your Target
Your stop goes beyond the extreme of the collection event. For a long trade after SSL collection, the stop goes below the lowest point of the wick or the lowest close of the sweep. For a short trade after BSL collection, the stop goes above the highest point of the wick or the highest close of the sweep.
Your target is the opposing liquidity pool. If you entered long after SSL collection, target the BSL pool above. If you entered short after BSL collection, target the SSL pool below. This is the ERL to IRL to ERL cycle completing one full rotation. Minimum target is 2:1 risk-to-reward. With clean setups at significant pools, 3:1 and better is common.
Step 7: Manage the Trade
Once price moves 1R in your favour, move the stop to break even. After that, let the position run toward the opposing pool without interference. The institutional move that follows a genuine pool collection tends to follow through cleanly when you have traded in the right direction of the cycle.
Liquidity Pools and Order Blocks: Reading the Full Setup
Liquidity pools and order blocks are closely related, and the best setups in SMC often involve both at the same level.
An order block is the last opposing candle before a strong directional move that breaks market structure. When price returns to an order block, it is returning to a zone where institutional orders were originally placed. Many of the strongest order block reactions happen when the order block sits inside or adjacent to a liquidity pool that has not yet been collected.
Here is why that confluence matters. A bullish order block sitting at the same level as an SSL pool is telling you two things simultaneously. First, institutions originally entered long from this zone, and those orders may still be partially unfilled. Second, the stop losses from the traders who went short at that zone are sitting just below it in an SSL pool. When price returns to that zone, it may briefly dip below to collect the SSL (grab or sweep), and then react strongly from the order block. That two-step move, first the pool collection and then the order block reaction, is one of the highest-probability setups in the entire SMC framework.
The practical rule: when an order block and a liquidity pool are at the same price zone, give the setup significantly more weight. The pool explains why price came there. The order block explains why price reacts from there.
Liquidity Pools Across Timeframes
Liquidity pools are fractal. The same logic that creates a pool at a daily swing high also creates pools at hourly swing highs and even 5-minute micro-highs. The key difference is the significance of each pool based on the timeframe where it formed.
Daily and weekly pools carry the most institutional weight because the stop losses sitting at those levels come from traders managing larger positions over longer time horizons. A collection of a weekly high or low signals major institutional repositioning and typically leads to a sustained move of several days or more.
4-hour pools are the bread and butter of swing traders using SMC. They carry meaningful weight, appear frequently enough to provide regular setups, and align well with kill zone trading during London and New York sessions.
1-hour pools are useful for entry timing after a higher-timeframe pool has been collected. They should be traded in the direction established by the higher timeframe rather than as standalone setups.
15-minute and lower pools are primarily for intraday scalping within an already confirmed directional bias. They should never be traded as the primary reason for a trade but rather as the final precision layer for entry timing.
The multi-timeframe approach is always top-down. Identify your primary pool on the daily or 4-hour chart, confirm the collection event, and use the 1-hour or 15-minute chart to time the entry. For the institutional framework that explains how pools are targeted across quarterly and monthly timeframes, the GhostTraders guide on Quarterly Shifts and IPDA Data Ranges explains how the biggest pool collection events fit into the broader institutional planning cycle.
Common Mistakes Traders Make With Liquidity Pools
Treating every pool as a reversal zone
A pool does not guarantee a reversal. It identifies where orders are sitting. Sometimes after collection, price reverses cleanly. Sometimes it continues in the same direction after a brief pause. The CHoCH on a lower timeframe is what separates a confirmed reversal trade from an assumption.
Ignoring the ERL to IRL cycle
Trading a pool without knowing where you are in the cycle is guessing. If price has just collected SSL and is drawing toward an unfilled FVG above, buying the SSL collection aligns with the cycle. But if that FVG is already filled and the next ERL is below price, the same SSL level may not hold. Context determines conviction.
Prioritising low-significance pools over high-significance ones
A 5-minute micro-low does not carry the same weight as a daily swing low. Newer traders often trade every visible pool they can find rather than being selective. Focus on pools that are obvious to the majority of market participants. If you had to point it out carefully for someone to see it, it probably does not have enough orders sitting there to drive a significant move.
Entering before collection is confirmed
Anticipating a pool collection and entering before the grab or sweep completes means you may be in the position as price extends further against you. Wait for the close back inside the range before beginning your lower-timeframe analysis.
Placing the stop too tight
The stop must go beyond the extreme of the collection event, not at the level itself. Price returned to that zone once already. It is entirely possible for price to test the zone one more time before the reversal fully develops. A stop inside the wick zone gets hit by that retest and takes you out before the real move begins.
Confusing pool types
Treating an internal range level like a pool target when the actual ERL is still uncollected above or below creates misaligned trades. ERL pools at previous highs and lows are the primary targets. IRL imbalances are where you enter after ERL is collected. Do not mix the roles of these two concepts.
For the full methodology on using BSL and SSL pools to build and maintain a directional bias before price makes its move, the GhostTraders guide on Liquidity-Based Bias walks through the complete decision-making process from pool identification to directional commitment.
The Liquidity Pool Trade Checklist
Before entering any trade from a liquidity pool setup, confirm every item below. Every item should be a clear yes before you act.
- Have I identified the pool type (BSL or SSL) and its significance on the higher timeframe?
- Is this pool uncollected and still active (price has not already closed through it)?
- Did price collect the pool via a grab or sweep with a close back inside the prior range?
- Is my directional bias after collection confirmed by the CHoCH on a lower timeframe?
- Is there a valid unmitigated FVG from the collection impulse to use as my entry?
- Is my stop placed beyond the extreme of the collection event, not at the pool level itself?
- Does the opposing pool give me at least 2:1 risk-to-reward as a target?
- Does this pool align with the current ERL to IRL cycle direction on the higher timeframe?
- Am I trading during a high-volume session window (London open or New York open)?
- Is there a nearby order block at the same level adding confluence to the setup?
If any of these are not clearly confirmed, the setup is not ready. Wait for the next one.
Frequently Asked Questions
What is a liquidity pool in forex?
A liquidity pool in forex is an area on a chart where stop losses and pending orders from retail traders have accumulated at a key price level. Previous highs and lows, equal highs and lows, consolidation extremes, and psychological round numbers are the most common locations. Institutions target these pools to fill large orders at favourable prices, using the retail orders as the other side of their trade.
What is the difference between BSL and SSL?
Buy Side Liquidity (BSL) pools sit above previous highs and contain buy stop orders from short sellers and breakout buyers. Sell Side Liquidity (SSL) pools sit below previous lows and contain sell stop orders from long traders and breakout sellers. A collection of BSL is a bearish signal. A collection of SSL is a bullish signal.
How do liquidity pools connect to liquidity grabs and sweeps?
Liquidity pools are where the orders accumulate. Grabs and sweeps are the mechanisms through which those orders get collected. A grab collects a pool in a single aggressive candle with a long wick. A sweep collects a pool over multiple candles, sometimes with a brief consolidation beyond the pool level before reversal. After collection by either method, the resulting move draws toward the nearest Internal Range Liquidity target, which is typically a Fair Value Gap.
What are equal highs and equal lows and why are they significant?
Equal highs are two or more price highs that occur at nearly the same level. Equal lows are two or more price lows at nearly the same level. They are significant because each failed test of the same level adds more stop loss orders to the pool sitting beyond that level. By the time price returns to break an equal high or low, the pool there is substantially larger than at a swing high or low that was tested only once. That larger pool makes the resulting move after collection stronger and more sustained.
How do I identify which liquidity pool will be targeted next?
Use the ERL to IRL cycle as your guide. After External Range Liquidity is collected at a pool, price draws toward Internal Range Liquidity (a Fair Value Gap or order block inside the range). Once IRL is tapped, price draws back toward the next ERL pool at the opposing end of the range or at the next significant structural level. Knowing where you are in this cycle tells you which pool is next on the institutional agenda.
Do liquidity pools work on all timeframes?
Yes. The same pool logic applies on every timeframe from monthly charts down to 1-minute charts. However, the weight of each pool depends entirely on the timeframe where it formed. Daily and weekly pools carry the most institutional significance. Lower timeframe pools are best used for entry precision after a higher-timeframe pool has already been collected.
Can liquidity pools be used in markets other than forex?
Absolutely. The same stop loss and pending order clustering that creates liquidity pools in forex exists in every liquid market, including equities, indices, commodities, and crypto. Wherever retail traders place predictable orders at predictable levels, institutions can and do use those order clusters as fuel for their own positioning. The mechanics are identical regardless of the market.
What is the best timeframe to trade liquidity pools?
Identify your primary pools on the daily or 4-hour chart. Use the 1-hour chart for CHoCH confirmation and FVG identification after the collection event. Use the 15-minute chart for final entry timing within the FVG. Always work from the higher timeframe down. Never start with a low timeframe and try to work up: by the time you identify the pool and the collection on a low timeframe, you have usually already missed the entry.
Conclusion
Liquidity pools in forex are where the money is. That is not a figure of speech. Stop losses and pending orders sitting at predictable levels represent real capital waiting to be triggered, and institutions collect that capital every time they need to fill a large position. Understanding where pools form, which ones carry the most weight, and how grabs and sweeps collect them gives you the same map that institutions are already using.
The framework that brings it all together is the ERL to IRL cycle. Pools at external range levels get collected. The collection creates an internal imbalance in the form of a Fair Value Gap. That FVG becomes the next draw on price. Once the FVG is filled, price draws back toward the next external pool. That cycle repeats across every timeframe, and reading it accurately is what allows you to position entries before the move rather than chasing it after.
The step-by-step process is straightforward once the concepts are clear. Mark your pools. Wait for collection. Confirm the CHoCH on a lower timeframe. Enter at the FVG with a stop beyond the collection extreme and a target at the opposing pool.
To go deeper on each concept covered in this article, these GhostTraders guides take each piece further:
- What Is Liquidity in Trading: the full foundation of how institutional liquidity works and why price is drawn to specific levels.
- External and Internal Range Liquidity: how to define your range, identify ERL and IRL, and use the cycle for daily bias.
- Liquidity Grabs: how to identify and trade the single-candle pool collection event.
- Liquidity Sweeps: how to identify and trade the multi-candle pool collection event.
- Liquidity-Based Bias: how to use pool locations to set your directional bias before the market moves.
- Quarterly Shifts and IPDA Data Ranges: how institutional traders plan their pool collection targets across 20-day data windows and quarterly cycles.
Risk Disclosure: Trading foreign exchange and financial derivatives carries a high level of risk and may not be suitable for all investors. All content on GhostTraders is for educational purposes only and does not constitute financial advice. Never trade with capital you cannot afford to lose. Author: Ndumiso Phelembe, Founder of GhostTraders, with over a decade of experience in institutional trading methodology.
