
A liquidity sweep in trading is one of the most misunderstood moves on a chart. Most retail traders see it as a random wick or a stop hunt and move on. Smart money traders see it as the starting gun. The sweep is where the real trade begins, because it tells you exactly where institutions just collected the fuel they needed to make their next big move.
This guide breaks down what a liquidity sweep is, how Buy Side Liquidity (BSL) and Sell Side Liquidity (SSL) work, how sweeps connect to the External Range Liquidity and Internal Range Liquidity cycle, and how to use all of it to build directional bias and find high-probability trade entries.
What Is a Liquidity Sweep in Trading?
A liquidity sweep happens when price moves beyond a key level, like a previous high or low, triggering the stop losses and pending orders sitting there, and then reverses back in the opposite direction. The institution did not break out. It raided the level, collected the liquidity sitting there, and used that fuel to enter a position in the actual direction it wanted to move.
The reason this matters is that retail traders treat highs and lows as support and resistance. They place their stop losses just beyond those levels, which is exactly what institutions are counting on. When enough stops pile up at a level, that level becomes a target, not a barrier.
After a liquidity sweep, price often reverses sharply. That reversal is not random. It signals that institutions have now filled their orders at that level using the retail stop losses as the other side of the trade. As a result, what looks like a breakout to most traders is actually the beginning of a reversal.
Understanding the mechanics behind a liquidity sweep in trading is what separates traders who react to price from traders who read it before it moves.
Buy Side Liquidity (BSL) and Sell Side Liquidity (SSL)
Before you can identify a liquidity sweep, you need to understand where liquidity sits and in what form.
Buy Side Liquidity (BSL)
Buy Side Liquidity refers to the cluster of pending buy orders and stop losses resting above key highs on a chart. These orders come from two groups of traders. First, short sellers who placed their stop losses above a high to limit their losses if price goes against them. Second, breakout traders who placed pending buy orders above the high expecting a continuation. Both groups have orders sitting above that high. When price moves up through that level, all of those orders trigger simultaneously, which gives institutions the liquidity they need to sell into the market at size.
In other words: BSL is where the sellers of the next move fill their orders. The sweep of BSL is a bearish signal.
Sell Side Liquidity (SSL)
Sell Side Liquidity refers to the cluster of pending sell orders and stop losses resting below key lows on a chart. These come from long traders who placed stops below a low to protect their positions, and from breakout sellers who placed pending orders below the low expecting a breakdown. When price sweeps below that level, all of those orders trigger together, giving institutions the liquidity they need to buy at size.
In other words: SSL is where the buyers of the next move fill their orders. The sweep of SSL is a bullish signal.
The core principle: BSL sits above highs and gets swept to facilitate institutional selling. SSL sits below lows and gets swept to facilitate institutional buying. This is the opposite of what most retail traders assume when they see price break a level.
Where Liquidity Accumulates on Your Chart
Not every high and low carries equal weight. The most significant liquidity pools form at the following levels:
Previous Day High and Low (PDH / PDL): One of the most reliable liquidity targets in intraday trading. The previous session’s high and low attract significant stop clusters because many traders reference these levels for their entries and exits.
Previous Week High and Low (PWH / PWL): Swing traders and fund managers reference these levels for their broader positions. Sweeps of weekly highs and lows carry strong institutional weight.
Previous Month High and Low (PMH / PML): These are macro liquidity levels that often determine the directional bias for the entire month ahead.
Equal Highs and Equal Lows: When price tests the same high or low multiple times without breaking it, stop orders accumulate significantly at those levels. Institutions know this. Equal highs are a magnet for a BSL sweep. Equal lows are a magnet for an SSL sweep.
Swing Highs and Swing Lows: Defined points of market structure where significant buying or selling occurred. These are the foundation of the ERL and IRL framework covered in the next sections.
Consolidation Extremes: When price moves sideways for an extended period, both BSL and SSL build up at the edges of that range. A sweep of either extreme signals the next directional move.
Liquidity Sweep vs Liquidity Grab: The Real Difference
These two terms are often used interchangeably but they describe different price behaviours. Knowing the difference helps you read the chart more accurately.
Feature | Liquidity Sweep | Liquidity Grab |
|---|---|---|
Duration | Can unfold over multiple candles | Happens within a single candle |
Price action | Moves beyond the level, consolidates briefly, then reverses | Wicks sharply through the level and immediately rejects |
Candle signature | Series of candles, sometimes a short consolidation beyond the level | Long-wick candle with a small body (Dragonfly or Gravestone Doji type) |
Confirmation | Takes longer, requires more patience before entry | Faster confirmation, wick is the signal |
Reliability | Higher when accompanied by a market structure shift | Strong when the wick is extreme relative to surrounding candles |
Both describe the same fundamental concept: price targets a liquidity level, triggers the orders there, and reverses. The grab is a faster, more aggressive version. The sweep is broader and sometimes tests the patience of traders waiting for reversal confirmation.
For trading purposes, either form is valid. What matters is what happens after the level is breached. A close back inside the previous range, followed by a market structure shift on a lower timeframe, is your confirmation that the sweep or grab is complete and the reversal is beginning.
External Range Liquidity and Internal Range Liquidity: The Full Picture
This is where GhostTraders’ approach goes deeper than what you will find in most liquidity sweep articles. To truly understand why price sweeps certain levels and what happens next, you need to understand the relationship between External Range Liquidity (ERL) and Internal Range Liquidity (IRL).
The foundation of this framework comes from how price constantly rotates between two types of liquidity targets. Once you see this cycle, you cannot unsee it.
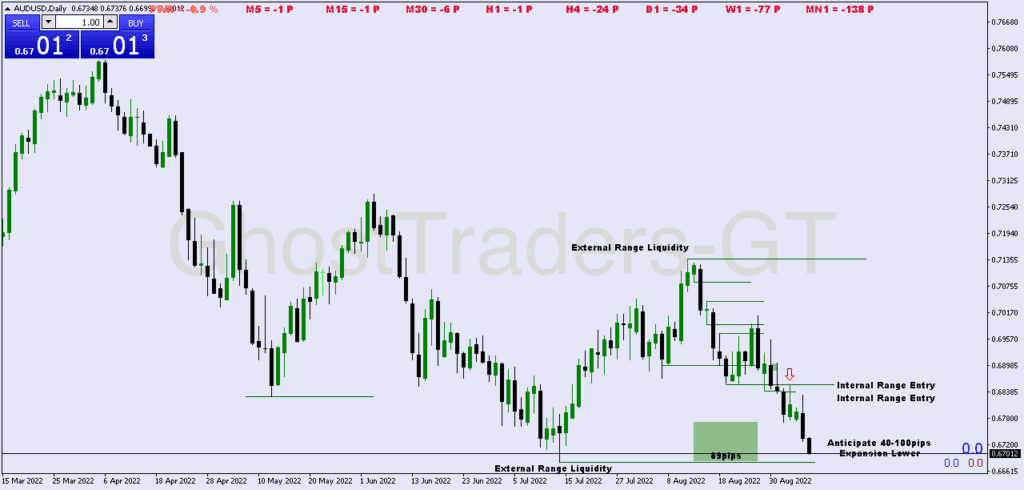
External Range Liquidity (ERL)
External Range Liquidity is the liquidity resting on the outside of a defined price range. Specifically, it sits at previous swing highs and previous swing lows. These are the BSL and SSL levels discussed earlier. ERL is what price targets when it is making a directional move to hunt stops and fill institutional orders.
To define your range, you identify a swing high and a swing low. The liquidity resting above that swing high is your BSL and your ERL to the upside. The liquidity resting below that swing low is your SSL and your ERL to the downside.
For a deep dive into how to define and trade External Range Liquidity, visit GhostTraders’ guide on External and Internal Range Liquidity.
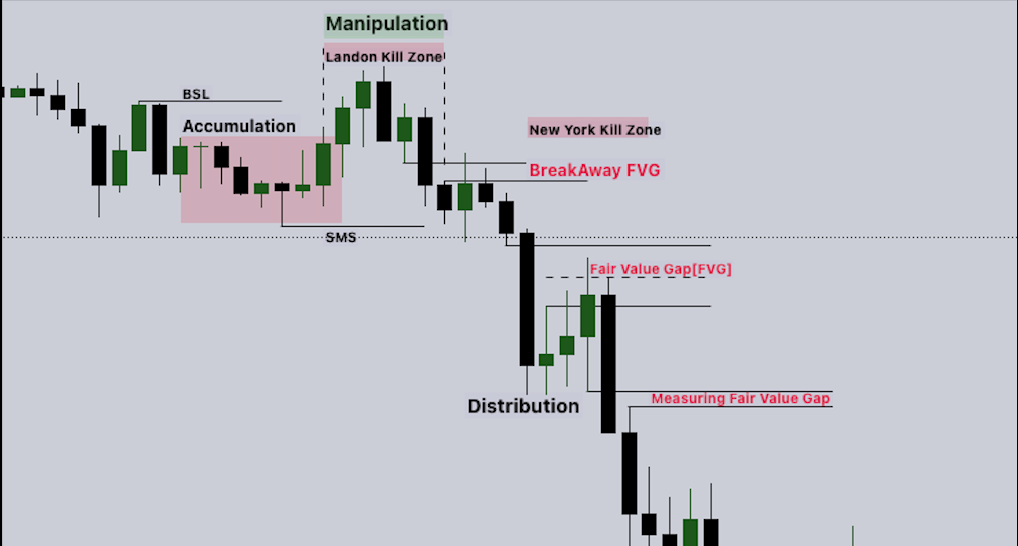
Internal Range Liquidity (IRL)
Internal Range Liquidity is the liquidity sitting inside the defined range. This is not BSL or SSL in the traditional stop-hunt sense. Instead, IRL consists of institutional reference points within the range that price rebalances toward after taking ERL. The most common forms of IRL are Fair Value Gaps (FVGs), order blocks, and volume imbalances.
Think of IRL as the destination price travels to after it has completed a sweep of ERL. The sweep of external liquidity is the trigger. The draw toward internal liquidity is the consequence.
How the ERL to IRL Cycle Drives Price
This is the single most important concept for building consistent directional bias. Once you understand this cycle, you stop guessing and start reading what price is already telling you.
Price constantly alternates between two actions:
From ERL to IRL: After sweeping external liquidity at a previous high or low, price reverses and draws toward internal range liquidity. The FVG created during the sweep move becomes the next target. Price rebalances by filling the gap before deciding its next direction.
From IRL to ERL: Once internal liquidity has been tapped and a Fair Value Gap is filled or an order block is respected, price sets off toward the next external liquidity target. This could be the opposite extreme of the range or the next significant swing high or low beyond the current structure.
The practical application works like this. If price sweeps SSL below a swing low (ERL taken to the downside), the next draw is toward the bullish FVG created during that sweep move (IRL). When price fills that FVG, the next draw becomes the previous swing high above (ERL to the upside). When that swing high is swept (BSL taken), the cycle repeats as price draws back toward an internal imbalance.
This cycle works across all timeframes. On a monthly chart, the ERL might be a quarterly high or low. On a 15-minute chart, it might be the previous session’s high or low. The mechanics are identical regardless of scale.
For understanding how this cycle applies at the macro quarterly level, GhostTraders breaks down the full framework in the Quarterly Shifts and IPDA Data Ranges guide. That article explains how institutional traders plan their liquidity targets across 20-day data ranges and quarterly shifts, which is the higher-timeframe context that explains why certain ERL levels matter more than others.
How Liquidity Sweeps Build Your Directional Bias
A liquidity sweep in isolation is not a trade. It is a bias-setter. Here is how to use it correctly.
When SSL is swept (price goes below a previous low, triggers stops, and reverses back up), your bias becomes bullish. Institutions have collected the selling liquidity they needed to enter long. You now look for buy opportunities, not sells.
When BSL is swept (price goes above a previous high, triggers stops, and reverses back down), your bias becomes bearish. Institutions have collected the buying liquidity they needed to enter short. You now look for sell opportunities, not buys.
This is the opposite of the breakout trader’s instinct. A retail breakout trader sees price above a high and goes long. A smart money trader sees that same move and prepares to go short once the reversal confirms.
Bias confirmation: A sweep alone does not confirm the trade. You need a market structure shift on a lower timeframe to confirm that the reversal has actually begun. This is called the Change of Character (CHoCH). Once price sweeps the level and breaks a short-term structural high (for bullish bias after an SSL sweep) or a short-term structural low (for bearish bias after a BSL sweep), your bias is confirmed and your entry is close.
GhostTraders covers the full process of building directional bias from liquidity in the Liquidity-Based Bias guide. That article walks through exactly how to use BSL and SSL targets across multiple timeframes to determine which direction the market is likely to move before it moves.
How to Trade a Liquidity Sweep Step by Step
Step 1: Define Your Range
On your trading timeframe, identify the most recent swing high and swing low. These form the boundaries of your working range. The liquidity above the swing high is your BSL. The liquidity below the swing low is your SSL. Mark both clearly.
Step 2: Identify the Sweep
Watch for price to move beyond one of these boundaries. A sweep of SSL means price moved below the swing low and returned back above it. A sweep of BSL means price moved above the swing high and returned back below it. The close back inside the range is the first confirmation.
Step 3: Wait for the Market Structure Shift
Drop to a lower timeframe (typically one or two timeframes below your working chart). Look for a Change of Character (CHoCH), which is the first break of structure in the new direction. After an SSL sweep, you want to see price break a short-term lower high to signal the bullish reversal. After a BSL sweep, you want to see price break a short-term higher low to signal the bearish reversal. Do not enter without this confirmation.
Step 4: Find Your Entry at IRL
Once the CHoCH confirms the bias, identify the Fair Value Gap or order block created during the sweep move. This is your Internal Range Liquidity, and it is your entry zone. Set a limit order at the FVG or at the Consequent Encroachment level (the 50% midpoint of the gap) and wait for price to retrace into it.
Step 5: Set Your Stop and Target
Place your stop loss beyond the extreme of the sweep. For a bullish trade after an SSL sweep, the stop goes below the swept low. For a bearish trade after a BSL sweep, the stop goes above the swept high.
Your first target is the opposing liquidity level. If you entered long after an SSL sweep, target the BSL above. If you entered short after a BSL sweep, target the SSL below. This is the ERL to IRL to ERL cycle completing its rotation.
Minimum target: the 50% level of the prior range. Ideal target: the opposing external liquidity pool at the other end of the range.
Step 6: Manage the Trade
Once price moves 1R in your favour, move your stop to break even. Let the trade breathe toward the target. Liquidity sweeps that reverse cleanly with a CHoCH confirmation and an FVG entry often deliver 3:1 or better when you let them run to the next ERL.
Liquidity Sweeps and Kill Zones: When Timing Matters
The most reliable liquidity sweeps happen during high-volume sessions. This is not a coincidence. Institutions need volume to execute large orders without causing excessive slippage. The kill zones are the windows when that volume is available.
London Open (2:00 AM to 5:00 AM EST): This is one of the prime windows for SSL and BSL sweeps. Asian session highs and lows accumulate liquidity overnight. London frequently sweeps those levels within the first hour or two of the session before establishing the directional move for the European day.
New York Open (7:00 AM to 10:00 AM EST): The New York open often sweeps the London session high or low before moving in the actual direction. This is called the “New York Judas Swing” in ICT terminology. Price makes a false move in one direction during the early New York session, sweeps liquidity, reverses, and then makes the real move for the day.
New York Lunch (12:00 PM to 1:00 PM EST): Typically low volume, which means sweeps during this window are less reliable. Avoid trading liquidity sweeps during the lunch hour unless the setup is exceptionally clean.
Pairing your liquidity sweep setups with the right kill zone significantly increases reliability. A sweep of BSL at the New York open that forms a bearish CHoCH and creates a bearish FVG is a far stronger setup than the same configuration during the Asian session when volume is thin.
Common Mistakes Traders Make With Liquidity Sweeps
Trading the sweep as a breakout
The most expensive mistake. When price sweeps above a high, the instinct is to buy. The correct read is the opposite: a sweep above a BSL level is a setup for a sell, not a buy. Identifying sweeps correctly requires retraining your instinct about what price breaking a level actually means.
Entering before the CHoCH confirms
Seeing a sweep and immediately entering a reversal trade is premature. Price can sweep a level and continue in the same direction. Wait for the market structure shift on the lower timeframe before committing capital. The CHoCH is not optional.
Ignoring the ERL to IRL context
A sweep without knowing where price is in the ERL to IRL cycle can lead to entering against the dominant draw on liquidity. If price has just swept ERL and needs to travel back to an unfilled IRL, your sweep entry aligns perfectly. If price is already between IRL and the next ERL target, a sweep trade in the wrong direction puts you against the flow.
Using the wrong timeframe for the sweep
Higher timeframe sweeps produce more reliable setups because the liquidity sitting at those levels is greater. A sweep of a daily swing low is more significant than a sweep of a 5-minute micro-low. Start your analysis on the 4-hour or daily chart to identify the key BSL and SSL levels, then use lower timeframes only for entry timing.
Missing the kill zone context
Trying to trade liquidity sweeps at 3:00 AM during the dead Asian session is a different proposition than trading the same setup at the London open. Volume matters. The kill zone context determines whether institutions are active enough to follow through on the reversal.
Trading mitigated FVG entries after the sweep
The Fair Value Gap formed during the sweep move is a one-time entry. Once price fills it, that entry is gone. Do not attempt to re-enter from the same gap after it has already been mitigated.
The Liquidity Sweep Trade Checklist
Before entering any trade based on a liquidity sweep, confirm every item on this list.
- Have I clearly identified the BSL or SSL level that was swept?
- Did price close back inside the range after the sweep (confirmation the sweep is complete)?
- Is there a CHoCH on the lower timeframe confirming the reversal direction?
- Does my bias align with the current ERL to IRL cycle? (Am I trading toward IRL after ERL was taken?)
- Is there a valid unmitigated FVG or order block from the sweep move to use as my entry?
- Is my stop placed beyond the extreme of the sweep (below the swept low for longs, above the swept high for shorts)?
- Is there a clear liquidity target at the opposing end of the range for my take profit?
- Am I trading during a kill zone window with sufficient volume to support the move?
- Is my risk per trade within my allowed limit (1% to 2% for prop firm accounts)?
If any of these are not clearly confirmed, wait for the next setup.
Frequently Asked Questions
What is a liquidity sweep in trading?
A liquidity sweep is when price moves beyond a key level like a previous high or low, triggers the stop losses and pending orders sitting there, and then reverses in the opposite direction. It is a mechanism used by institutions to collect the liquidity they need to enter large positions without causing excessive slippage.
What is the difference between BSL and SSL?
Buy Side Liquidity (BSL) sits above previous highs where short sellers have placed stop losses and breakout buyers have placed pending orders. Sell Side Liquidity (SSL) sits below previous lows where long traders have their stop losses and breakout sellers have their pending orders. A sweep of BSL is a bearish signal. A sweep of SSL is a bullish signal.
What is the difference between a liquidity sweep and a liquidity grab?
A liquidity grab is a single-candle event where price wicks sharply through a level and immediately reverses, leaving a long wick on the candle. A liquidity sweep unfolds over multiple candles, sometimes with a brief consolidation beyond the level before the reversal. Both indicate the same fundamental event but with different speed and aggression.
How do liquidity sweeps connect to External and Internal Range Liquidity?
External Range Liquidity (ERL) is the liquidity sitting at previous swing highs and lows, which is where BSL and SSL accumulate. A liquidity sweep is the event that takes ERL. After ERL is swept, price draws toward Internal Range Liquidity (IRL), which consists of Fair Value Gaps and order blocks inside the range. This ERL to IRL cycle is the engine that drives most directional price moves in the market.
Do liquidity sweeps always result in a reversal?
Not always. Sometimes price sweeps a level and continues in the same direction, which is called acceptance rather than rejection. The key difference is whether price closes back inside the prior range after the sweep. If it does, the sweep has rejected and a reversal is likely. If price closes and holds beyond the level, it may be a genuine breakout rather than a sweep. The CHoCH on a lower timeframe is your confirmation that the reversal is real.
What is the best timeframe to trade liquidity sweeps?
Identify your BSL and SSL levels on the 4-hour or daily chart where the liquidity pools carry the most weight. Use the 1-hour chart to watch for the CHoCH and identify the FVG entry zone. Use the 15-minute chart to time your exact entry within the FVG. Always work from the higher timeframe down to the lower timeframe, not the other way around.
Can liquidity sweeps be traded in crypto and stocks?
Yes. The mechanics of BSL, SSL, and liquidity sweeps apply to any liquid market. The concept works in crypto, indices, equities, and commodities. The underlying reason is the same in all markets: institutions need liquidity to fill large orders, and retail stop losses at obvious highs and lows provide that liquidity. The principle is universal.
Conclusion
A liquidity sweep in trading is not a stop hunt you need to fear. It is a map you can read. When price sweeps BSL above a high and reverses, institutions have just positioned short. When price sweeps SSL below a low and reverses, institutions have just positioned long. Your job is to wait for the confirmation, find the internal liquidity draw that comes next, and position yourself in the same direction as the move that is already underway.
The key to trading sweeps consistently comes down to three things. First, knowing your BSL and SSL levels before price reaches them. Second, waiting for the CHoCH on the lower timeframe before entering, because without that confirmation you are guessing. Third, using the ERL to IRL cycle to understand where price is heading after the sweep completes.
Combine this with the right kill zone timing and a clean FVG entry, and liquidity sweeps become some of the highest-conviction setups in the SMC framework.
To go deeper on each component of this framework, explore these related GhostTraders guides:
- External and Internal Range Liquidity: how to define your range and identify ERL and IRL on any timeframe.
- Quarterly Shifts and IPDA Data Ranges: how institutional traders plan their liquidity targets across 20-day data windows and quarterly shifts.
- Liquidity-Based Bias: how to use BSL and SSL to build a directional bias before the market moves.
Risk Disclosure: Trading foreign exchange and financial derivatives carries a high level of risk and may not be suitable for all investors. All content on GhostTraders is for educational purposes only and does not constitute financial advice. Never trade with money you cannot afford to lose. Author: Ndumiso Phelembe, Founder of GhostTraders, with over 10 years of experience in institutional trading methodology.
