
Liquidity in trading is the reason price moves the way it does. It is not just a technical definition of bid-ask spreads. It is the fuel that powers every significant move in the market, the target that institutions hunt before making their real move, and the framework that explains why price keeps doing the same things at the same types of levels. Understanding liquidity in trading at this level changes how you read every chart you ever look at.
This guide covers two layers. First, the foundation: what liquidity means in a traditional sense and why it matters for your execution. Second, the institutional layer: how Smart Money uses Buy Side Liquidity (BSL) and Sell Side Liquidity (SSL) to manufacture the moves that trap retail traders, and how you can read that activity before it happens.
Liquidity in Trading: The Foundation
Three things determine how liquid a market is at any given moment. The bid-ask spread measures the gap between what buyers will pay and what sellers will accept. A tighter spread signals higher liquidity and lower cost per trade. Trading volume shows how many transactions are happening. Higher volume means more participants are active and orders fill more easily. Market depth describes how many buy and sell orders sit at various price levels. A deep market can absorb large orders without the price shifting dramatically.
In a liquid market you enter and exit positions at or very close to the price you see on your screen. In an illiquid market even a moderately sized order can push price against you before it fills. That gap between your intended price and where you actually get filled is called slippage, and it is a real cost that compounds over hundreds of trades.
For retail traders, liquidity affects the cost of every trade, the reliability of technical analysis, and how markets respond to news. It also sets the conditions under which institutional traders operate, which is where the real edge in understanding liquidity comes from.
Why Liquidity Matters for Your Trading
Most retail traders think about liquidity as something that affects order execution. That is true, but it is only the surface level. Here is why liquidity matters at every stage of the trading process.
Execution quality. In a highly liquid market like EUR/USD during the London session, your order fills at or extremely close to your intended price. In a thinly traded exotic pair during the Asian session, your order may fill several pips away from where you clicked. Over hundreds of trades, that difference compounds significantly.
Spread costs. Liquid markets have tighter spreads. Every trade you take costs you the spread, so a market that consistently trades at a 0.1 pip spread is dramatically cheaper to trade than one consistently sitting at 3 pips. For active traders, this is a meaningful portion of trading costs over a month.
Technical reliability. Support and resistance levels, order blocks, and fair value gaps all work more reliably in liquid markets because there are enough participants to respect and react to those levels. In illiquid conditions, a single large order can blow through a level that would normally hold. This is why most SMC traders avoid the Asian session for their primary setups.
Risk management. Stop losses get hit at predictable prices in liquid markets. In illiquid conditions, price can gap through your stop and fill you at a much worse level. This is called gap risk and it is a real cost that most new traders do not account for.
High Liquidity vs Low Liquidity: The Practical Difference
Feature | High Liquidity | Low Liquidity |
|---|---|---|
Bid-ask spread | Tight, often fractions of a pip | Wide, sometimes several pips |
Slippage | Minimal, fills close to intended price | Significant, fills can be far from intended price |
Order execution | Fast, efficient | Slow, potentially partial fills |
Price stability | Smooth, consistent movement | Erratic, prone to sharp unexplained moves |
Technical reliability | High, levels respected consistently | Low, false breaks more common |
Suitable for | Most trading styles | Only specific strategies built for low liquidity |
The practical implication is simple. For the majority of retail traders, major forex pairs during active sessions are the best trading conditions available. EUR/USD, GBP/USD, USD/JPY, and AUD/USD during London and New York sessions offer the tightest spreads, the most reliable price action, and the clearest institutional footprints.
The Most Liquid Markets in the World
Understanding which markets are most liquid helps you choose where to focus your attention.
Forex is the most liquid financial market globally, with daily trading volume exceeding six trillion dollars. Major currency pairs like EUR/USD and GBP/USD trade with extremely tight spreads around the clock during active sessions. This liquidity comes from the participation of central banks, commercial banks, hedge funds, corporations hedging currency exposure, and retail traders worldwide.
Equity indices like the S&P 500, NASDAQ, and FTSE 100 are highly liquid during their respective market hours. Futures contracts on these indices trade nearly 24 hours a day with high volume.
Gold (XAU/USD) is one of the most liquid commodities globally. During peak hours it behaves very similarly to major forex pairs in terms of liquidity depth.
Bitcoin and Ethereum have grown significantly in liquidity but still experience periods of thinner participation, particularly during low-volume windows. SMC concepts apply here, but with awareness that liquidity events can be more volatile.
Exotic forex pairs like USD/ZAR or EUR/TRY carry significantly lower liquidity. Spreads are wider, price action is less predictable, and institutional footprints are harder to read clearly.
How Smart Money Sees Liquidity Differently
For retail traders, liquidity is about execution conditions. For institutions, liquidity is the raw material they need to build positions.
A hedge fund wanting to enter a 500 million dollar position in EUR/USD cannot simply click buy on a trading platform. Doing so would push price significantly upward before the order is even half filled, costing the fund enormously through slippage. Instead, the fund needs a counterparty on the other side of the trade, specifically a wave of sell orders large enough to absorb the full position without distorting the fill price.
The most reliable source of those sell orders? Retail traders’ stop losses. Short sellers place stop losses above recent highs. Breakout buyers place pending buy orders above those same highs. Over time, both sets of orders pile up at predictable levels, and those clusters of orders become the liquidity that institutions need to fill large positions.
This is why institutions drive price toward obvious levels before making their real move. They are not breaking out above a high because they want to go long. They are hunting the buy stops sitting above that high so they can use them to sell into at size. Once those buy stops trigger and the institution has filled its short position, the buy pressure evaporates and price drops. What looked like a breakout was actually a liquidity collection event.
Understanding this dynamic is the foundation of trading with Smart Money rather than against it. For a complete breakdown of how this works across different market structures and conditions, the full context is covered in the GhostTraders guide on liquidity pools in forex.
Buy Side Liquidity (BSL) Explained

Buy Side Liquidity refers to the cluster of buy orders resting above key highs on a chart. These orders come from two main sources.
First, short sellers protect their positions with stop losses placed above recent highs. If they are short and price moves up through their stop level, the stop triggers a buy order that closes their short. Second, breakout traders place pending buy orders above highs, expecting that a break above the level signals continuation upward.
Both groups have orders sitting at roughly the same area above the high. When price spikes through that level, all those buy orders trigger simultaneously. The resulting wave of buying is what institutions sell into. They needed sellers to take the other side of a large long position, and the BSL pool just provided them.
The signal from a BSL collection is bearish. When price drives above a key high and closes back below it, institutions have filled their sell. The move lower is the real direction. This is the direct opposite of what breakout trading teaches, and it is why so many retail breakout traders get stopped out immediately after entering.
Where BSL accumulates:
- Above previous swing highs
- Above equal highs where price has tested the same level multiple times
- Above the previous day high (PDH)
- Above the previous week high (PWH)
- Above the previous month high (PMH)
- Above consolidation range highs where breakout buyers are waiting
Sell Side Liquidity (SSL) Explained
Sell-side liquidity refers to the cluster of sell orders resting below key lows. These come from long traders who placed stop losses below recent lows to cap their downside, and from breakout sellers who placed pending sell orders below lows, expecting continuation downward.
When price drops below a key low and triggers those sell orders, institutions buy into that selling pressure. The wave of sell orders filling gives institutions the counterparty they need to enter large long positions at an efficient price. Once the SSL is collected, the selling pressure from triggered stops evaporates and price reverses upward.
The signal from an SSL collection is bullish. A spike below a recent low that closes back above it is a sign that institutions have filled their buy orders at that level. The move higher is the real direction.
Where SSL accumulates:
- Below previous swing lows
- Below equal lows where price has tested the same level multiple times
- Below the previous day low (PDL)
- Below the previous week low (PWL)
- Below the previous month low (PML)
- Below consolidation range lows where breakout sellers are waiting
Where Liquidity Accumulates on Your Chart
The most reliable liquidity pools share one characteristic: they are obvious to the majority of traders looking at the same chart. The more visible the level, the more orders accumulate there, and the more significant the collection event when price eventually reaches it.
Swing highs and swing lows are the most common liquidity locations. Any clearly defined point where price made a high followed by lower prices, or a low followed by higher prices, will have BSL or SSL sitting just beyond it.
Equal highs and equal lows are the highest-priority targets on any chart. When price tests the same high or low two or more times without breaking it, every failed test adds more orders to the pool. By the time price finally reaches that level with intent, the accumulated orders there make the collection event significantly more powerful than at a single-touch swing high or low.
Session highs and lows from the previous day, week, and month are referenced by traders worldwide. That universal reference creates predictable order clustering at these levels, making them consistent liquidity targets.
Consolidation range extremes accumulate both BSL and SSL at their boundaries. The upper edge holds buy stops from breakout buyers and stop losses from traders who went short inside the range. The lower edge holds sell stops from longs and breakout sell orders from traders expecting a downward break.
Round numbers and psychological levels attract orders because traders naturally anchor to clean numbers. Levels ending in 00 or 50 will always carry more orders than less memorable adjacent prices.
How Institutions Use Liquidity: Stop Hunts and Liquidity Pools
Stop hunts and liquidity pools are two ways of describing the same underlying event from different angles.
A stop hunt describes the action from the retail trader’s perspective. Their stop loss at a predictable level gets triggered by a spike that immediately reverses, taking them out of a trade before the real move. It feels manipulative because it is. Institutions deliberately drive price to those levels.
A liquidity pool describes the same event from the institutional perspective. The cluster of orders at a key level is the pool. The institutional move into that pool to trigger those orders and collect the liquidity is the mechanism by which large positions get filled at efficient prices.
Both descriptions are accurate. The difference is in whose perspective you take. Retail traders experience stop hunts as bad luck. Smart money traders recognise them as predictable institutional behaviour at identifiable levels and use them as entry signals rather than exit triggers.
Liquidity Grabs and Sweeps: How the Collection Happens
Institutions collect liquidity in two ways. Knowing which one you are looking at determines your entry timing.
A liquidity grab happens within a single candle. Price spikes aggressively through a BSL or SSL level, triggers the orders there, and closes back inside the prior range within that same candle. The result is a long-wick candle at a key level. A bullish grab at SSL produces a long lower wick. A bearish grab at BSL produces a long upper wick. The close back inside the range is the first confirmation that the collection is complete.
A liquidity sweep unfolds over multiple candles. Price moves through a BSL or SSL level and may consolidate briefly beyond it before reversing back inside the range. The confirmation comes when price closes back inside after spending time beyond the pool level.
Both signal the same outcome: institutional orders have been filled and the real directional move is about to begin. The grab gives you faster confirmation. The sweep requires more patience. For a full breakdown of how to trade each method, the GhostTraders guides on liquidity grabs and liquidity sweeps cover both approaches in detail.
External Range Liquidity (ERL) and Internal Range Liquidity (IRL)

This is the framework that connects every concept above into a coherent map of where price is going and why.
External Range Liquidity (ERL) is the liquidity sitting at the boundaries of a defined price range. It is your BSL above the range high and your SSL below the range low. These are the pools that price is eventually drawn to collect. ERL is the destination that price travels toward.
Internal Range Liquidity (IRL) is the liquidity sitting inside the range. Rather than BSL or SSL pools, IRL takes the form of Fair Value Gaps and order blocks. These are the institutional reference points that price rebalances toward after taking ERL.
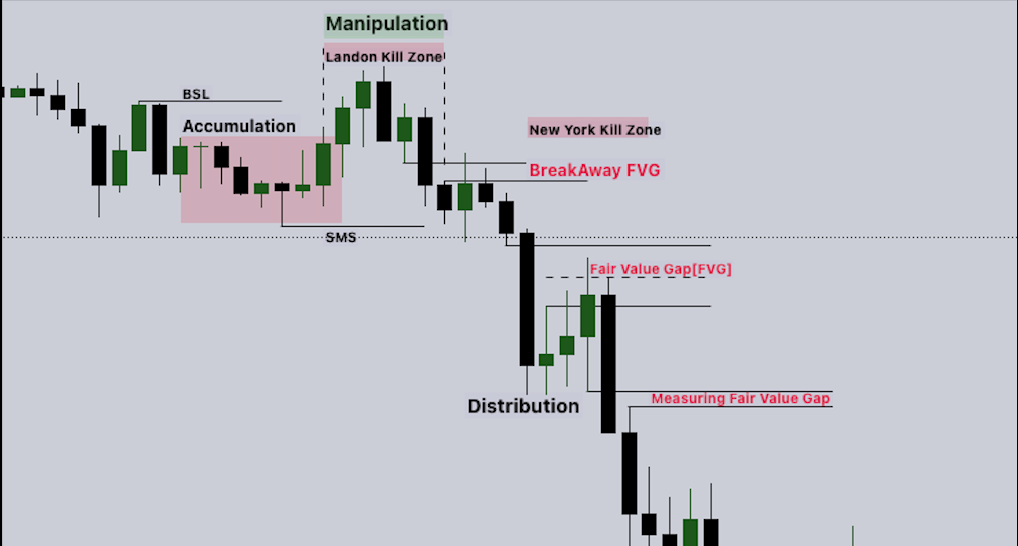
The cycle between them is what drives the majority of directional price moves. After ERL is taken at a pool level, price draws toward IRL inside the range. Once IRL is mitigated, price draws back toward the next ERL at the opposing boundary. That rotation repeats across every timeframe.
In practice this means: after an SSL collection at a swing low, the next draw is toward the bullish Fair Value Gap created by the impulse move. Once that gap is filled, the next target becomes the BSL above. When that BSL gets collected, the next draw becomes a bearish FVG below. The cycle continues.
For the complete breakdown of how to define your range, identify ERL and IRL, and apply the cycle to daily bias, the GhostTraders guide on External and Internal Range Liquidity covers the full methodology.
How to Use Liquidity to Build Your Trading Bias
This is where understanding liquidity in trading becomes directly actionable. The location of uncollected BSL and SSL pools tells you which direction price is more likely to move next.
Step 1: Map your BSL and SSL. On the daily or 4-hour chart, mark every visible swing high where BSL is resting and every swing low where SSL is sitting. Pay specific attention to equal highs and equal lows.
Step 2: Identify which side of the market has the most liquidity. If there is a cluster of equal highs above and only a single swing low below, the probability favours a move upward to collect the BSL before any meaningful downside. Institutions go where the fuel is.
Step 3: Determine the ERL to IRL position. Has the nearest ERL already been collected? If so, the draw is toward IRL. If not, the draw is still toward the ERL pool. This tells you whether price is in a retracement phase or a trending phase.
Step 4: Wait for the collection event. Once your target pool is clear, wait for price to reach it. Watch for the grab or sweep, then confirm the reversal on a lower timeframe through a Change of Character (CHoCH).
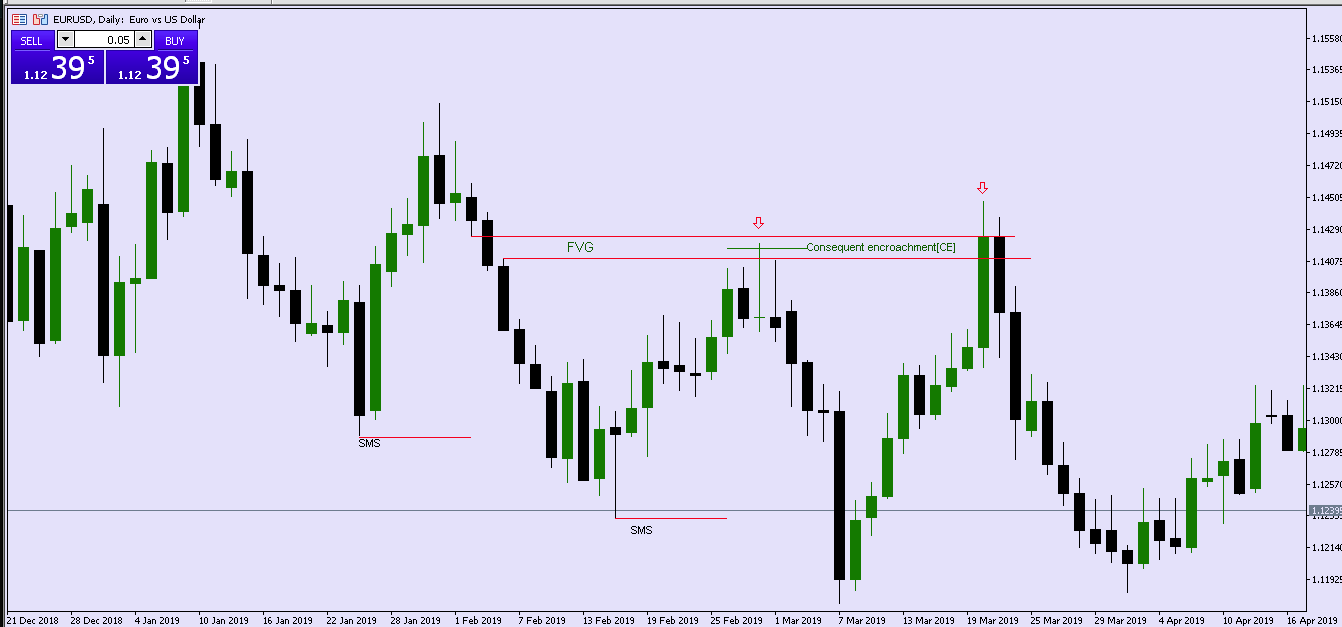
Step 5: Enter from the FVG. The Fair Value Gap formed by the impulse that followed the collection is your entry zone. Set your limit order at the Consequent Encroachment level (the 50% midpoint of the FVG) and let price come to you.
For the full bias-building process using BSL and SSL across multiple timeframes, the GhostTraders guide on Liquidity-Based Bias walks through the complete decision-making framework. And for the institutional context of how liquidity targets are planned across quarterly and monthly cycles, the Quarterly Shifts and IPDA Data Ranges guide explains how the biggest collection events fit into the broader institutional calendar.
Liquidity and Session Timing: When It Matters Most
Not all market hours produce the same quality of liquidity events. The session windows where institutions are most active are where the most reliable BSL and SSL collections occur.
London Open (2:00 AM to 5:00 AM EST) is one of the most significant liquidity windows of the day. Asian session highs and lows accumulate overnight. London frequently sweeps those levels in the first one to two hours of the session before establishing the directional move for the European day.
New York Open (7:00 AM to 10:00 AM EST) often sweeps the London session high or low in what ICT traders call the Judas Swing. Price makes an early move in one direction, collects BSL or SSL, and then reverses into the real directional move for the day. This window produces some of the cleanest liquidity-based setups available.
Overlap (8:00 AM to 12:00 PM EST) is peak liquidity for most major forex pairs. Both London and New York are active simultaneously. Volume is highest and institutional footprints are clearest during this window.
Asian Session (7:00 PM to 2:00 AM EST) is typically a liquidity accumulation period rather than a collection period. Price tends to consolidate and build up BSL and SSL rather than aggressively sweep it. Avoid trading liquidity events as primary setups during this window unless you are specifically trading JPY pairs where Asian session participation is highest.
Common Mistakes Traders Make With Liquidity
Treating every level as equal. A swing high that formed on a 5-minute chart does not carry the same institutional weight as a weekly swing high. The size of the liquidity pool sitting at a level depends entirely on how many traders are referencing it. Focus on levels that are visible to the majority of market participants.
Fading every sweep immediately. Not every sweep of a BSL or SSL level results in a reversal. Sometimes price sweeps a level and accepts beyond it, signalling a genuine breakout. The close of the candle back inside the prior range is the critical filter. Without that confirmation, you are guessing.
Ignoring the ERL to IRL context. Trading a collection event without knowing where you are in the ERL to IRL cycle can put you on the wrong side of the dominant draw. If price is being pulled toward an unfilled FVG above, a minor SSL collection below may not hold before the upward draw resumes.
Placing stops at obvious levels. Most retail traders place their stops at swing highs and lows precisely because those are the obvious levels. Placing your stop at a level where liquidity is sitting means you are positioning yourself to be swept. Use the structure of the setup to place stops beyond the logical collection extreme rather than at the level itself.
Trading liquidity events in low-volume sessions. A BSL sweep during the Asian session on EUR/USD carries significantly less follow-through than the same setup at the New York open. Session timing changes the probability of the setup in ways that many traders ignore.
Entering before the CHoCH confirms. Seeing a grab or sweep and immediately entering a reversal trade is premature. Wait for the Change of Character on the lower timeframe. That structural confirmation separates a valid reversal from a setup where price pauses and then continues in the original direction.
Frequently Asked Questions
What is liquidity in trading in simple terms?
Liquidity in trading describes how easily an asset can be bought or sold without significantly moving its price. A liquid market has many active buyers and sellers, tight spreads, and fast order execution. In Smart Money Concepts, liquidity also refers to the clusters of stop losses and pending orders that accumulate at key price levels and that institutions deliberately target to fill their large positions.
What is the difference between BSL and SSL?
Buy Side Liquidity (BSL) sits above previous highs where short sellers have stop losses and breakout buyers have pending orders. A BSL collection is a bearish signal because institutions sold into those buy orders. Sell Side Liquidity (SSL) sits below previous lows where long traders have stops and breakout sellers have pending orders. An SSL collection is a bullish signal because institutions bought into those sell orders.
Why do institutions hunt liquidity?
Institutions trade in sizes that require significant counterparty volume to fill without excessive slippage. Retail stop losses and pending orders at predictable levels provide that counterparty volume. By driving price to those levels and triggering the orders there, institutions can fill large positions at efficient prices. The retail traders whose stops triggered become the other side of the institutional trade.
What are equal highs and equal lows?
Equal highs are two or more price highs at approximately the same level. Equal lows are two or more price lows at approximately the same level. These levels are significant because each failed test adds more stop loss orders to the pool. By the time price finally reaches and breaks the level, the accumulated orders make the resulting move stronger and more sustained than at a single-touch swing high or low.
What is the difference between a liquidity grab and a liquidity sweep?
A liquidity grab happens in a single candle: price spikes through a key level, triggers orders there, and closes back inside the prior range within that same candle. The evidence is a long-wick candle at a significant level. A liquidity sweep unfolds over multiple candles, sometimes with a brief consolidation beyond the level before the reversal. Both describe the same fundamental event but with different speed and duration.
How do I know which direction price will move after a liquidity collection?
After an SSL collection below a swing low, the bias turns bullish. After a BSL collection above a swing high, the bias turns bearish. Confirm the reversal by looking for a Change of Character (CHoCH) on a lower timeframe: a structural break in the new direction. Once confirmed, enter from the Fair Value Gap created by the collection impulse and target the opposing liquidity pool.
Which markets have the highest liquidity?
Forex is the most liquid financial market globally, with major pairs like EUR/USD offering extremely tight spreads and deep order books during active sessions. Equity index futures, gold, Bitcoin, and Ethereum also offer strong liquidity during peak hours. Exotic forex pairs, small-cap stocks, and low-volume altcoins are significantly less liquid and carry higher execution risk.
How does session timing affect liquidity?
Liquidity levels are highest during the London and New York sessions and lowest during the Asian session for non-JPY pairs. The most reliable BSL and SSL collection events happen during London open and New York open when institutional participation is highest. Collection events during the Asian session carry significantly less follow-through and are generally lower probability for reversal trades.
Conclusion
Liquidity in trading is the foundation of everything else in Smart Money Concepts. The bid-ask spread, the slippage, the session timing, the stop hunts, the BSL and SSL pools, the ERL to IRL cycle, the grabs and sweeps: all of it connects back to the same central question. Where is the money sitting, and how do institutions get to it?
Once you understand that question and its answer, you stop being surprised by false breakouts. You stop placing stops at the same obvious levels that institutions are targeting. You start reading price as a deliberate sequence of liquidity collection events rather than random movement. And you start positioning your entries after collections rather than before them, which is where the actual edge lives.
To go deeper on each piece of this framework, these GhostTraders guides cover every related concept in full:
- Liquidity Pools in Forex: where the eight types of liquidity pools form and how to trade from them.
- Liquidity Grabs: how to identify and trade single-candle BSL and SSL collection events.
- Liquidity Sweeps: how to trade multi-candle collection events using the ERL to IRL framework.
- External and Internal Range Liquidity: how the ERL to IRL cycle drives directional price movement across all timeframes.
- Liquidity-Based Bias: how to use BSL and SSL locations to set your directional bias before the market moves.
- Quarterly Shifts and IPDA Data Ranges: how institutions plan their liquidity targets across 20-day data windows and quarterly cycles.
Risk Disclosure: Trading foreign exchange and financial derivatives carries a high level of risk and may not be suitable for all investors. All content on GhostTraders is for educational purposes only and does not constitute financial advice. Never trade with capital you cannot afford to lose. Author: Ndumiso Phelembe, Founder of GhostTraders, with over a decade of experience in institutional trading methodology.
