
The previous day high (PDH) is the highest price reached during the prior trading session. The previous day low (PDL) is the lowest price reached during that same session. On your chart, these are the two horizontal lines you draw before each new session begins, marking the exact boundaries of where price traveled the day before.
They are the same every trading day: fixed reference points that do not change during the current session. That consistency is precisely what makes them useful. Every trader, algorithm, and institution references the same two levels, which means order activity around them is predictable and significant.
In traditional technical analysis, PDH and PDL are treated as support and resistance. In ICT and Smart Money Concepts, they are treated as liquidity targets: specific price levels where the orders of retail traders have accumulated and where institutional traders will deliberately drive price to collect those orders before making the real move.
Why PDH and PDL Matter in Trading
The reason PDH and PDL carry institutional weight every single day comes down to how retail traders respond to these levels automatically.
Traders who went short near the previous day high typically place their stop losses just above PDH. If they are wrong and price pushes higher, that stop triggers a buy order that closes their short. Traders watching for a breakout above PDH place pending buy orders just above the level, expecting an upward continuation. Both groups create a cluster of buy orders sitting above PDH, which is the buy side liquidity pool.
Below PDL, the mirror situation exists. Traders who went long near the previous day low place stop losses just below PDL. Breakout sellers place pending sell orders below PDL expecting continuation lower. Both groups create sell side liquidity below the level.
Institutions need large counterparty volume to fill their orders without excessive slippage. Those clustered retail orders at PDH and PDL provide exactly that volume. By pushing price to those levels, triggering the retail orders, and then reversing, institutions collect the liquidity they need to position at size. That reversal after the collection is the trade.
PDH as Buy Side Liquidity (BSL)
In ICT terminology, PDH is a Buy Side Liquidity (BSL) level. The buy orders sitting above it make it a target for institutional sellers. When institutions want to enter a large short position, they drive price above PDH, trigger all those buy orders (which become the sellers’ counterparty), fill their short at that spike high, and then push price lower.
The spike above PDH looks like a breakout to retail traders. Many buy the “break” expecting continuation. What they are actually doing is providing the liquidity institutions needed to go short. When price reverses back below PDH shortly after the spike, those breakout buyers are immediately in a losing position. Their exits add more selling pressure to the move.
A sweep of PDH followed by a close back below the level is a bearish signal in the SMC framework. The BSL has been collected. The real move is lower.
PDL as Sell Side Liquidity (SSL)
PDL is a Sell Side Liquidity (SSL) level. The sell orders sitting below it make it a target for institutional buyers. When institutions want to enter a large long position, they drive price below PDL, trigger all the sell stops there, fill their long using those sell orders as counterparty, and then push price higher.
The spike below PDL looks like a breakdown. Retail traders sell the “break” expecting further downside. They are providing the liquidity institutions need to buy at size. When price reverses back above PDL, those breakdown sellers are immediately offside and their exits add buying pressure.
A sweep of PDL followed by a close back above the level is a bullish signal. The SSL has been collected. The real move is higher.
For the full framework on how BSL and SSL pools form and how institutions use them across all market conditions, the GhostTraders guide on what is liquidity in trading covers the complete foundational context.
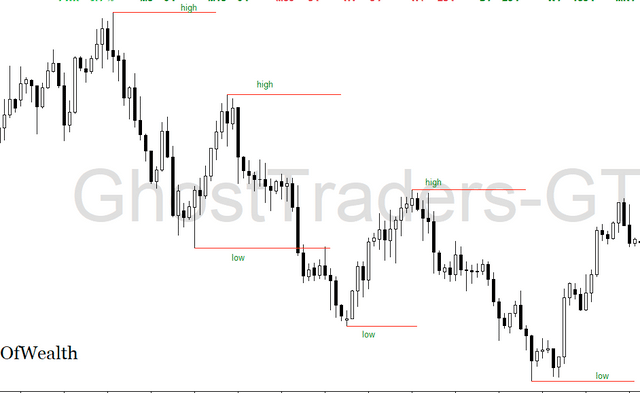
The Three Behaviours at PDH and PDL
Price does not behave the same way at PDH and PDL every day. Understanding which of three scenarios is unfolding tells you what to expect and whether to trade.
Scenario 1: The Sweep and Reversal
Price pushes above PDH or below PDL, triggers the orders there, and immediately reverses back inside the prior day range. This is the most common institutional use of these levels. The sweep collects the liquidity and the reversal is the real move.
Signal: Long wick candle at PDH or PDL with a close back inside the prior range. Follow with a lower-timeframe CHoCH to confirm.
Trade: Enter in the direction of the reversal from the FVG created by the sweep impulse. Target the opposing liquidity level.
Scenario 2: The Breakout and Acceptance
Price breaks above PDH or below PDL and holds beyond the level. Subsequent candles close and build structure beyond the prior day high or low. No immediate reversal occurs. This signals that the breakout is genuine and institutional momentum is in the direction of the break.
Signal: Multiple candle closes beyond PDH or PDL with no aggressive reversal back inside. Price holds the broken level as new support or resistance.
Trade: Wait for price to retrace to the broken PDH or PDL level after the initial expansion. Enter on the retest with a FVG or order block for confirmation. Trade in the direction of the breakout.
Scenario 3: The Rejection Without a Sweep
Price approaches PDH or PDL but does not breach the level. It simply reacts from below or above and moves away without triggering the orders sitting beyond the level. This is a level touch rather than a sweep. The BSL or SSL has not been collected.
Signal: Price approaches the level, wicks toward it but does not close beyond it, and moves back toward the range interior.
Implication: The liquidity at PDH or PDL is still resting. Price is likely to return and collect it later. Do not trade the rejection as if the liquidity event is complete because it is not.
Session Timing: When PDH and PDL Become Targets
Not all PDH and PDL touches carry the same weight. The session window in which price approaches these levels determines the quality of the setup significantly.
London Open (2:00 AM to 5:00 AM EST) is the primary window for PDH and PDL sweeps. During the Asian session, price ranges quietly and accumulates orders around the prior day boundaries. London frequently opens by sweeping one side of the Asian range, which often aligns with PDH or PDL, before establishing the directional move for the European day. Some of the cleanest PDH and PDL sweep setups occur in the first hour of the London session.
New York Open (7:00 AM to 10:00 AM EST) targets the opposite side from London when the Judas Swing is in play. If London swept PDL and moved higher, New York may push toward PDH before establishing the true trend. This session produces frequent PDH sweeps that create bearish reversal opportunities and PDL sweeps that create bullish reversal opportunities.
Asian Session (7:00 PM to 2:00 AM EST) builds the next day’s liquidity around PDH and PDL rather than collecting it. During this window, price tends to stay inside the range defined by the prior session. Treat Asian session touches of PDH and PDL as accumulation, not as sweep opportunities.
News events override session logic. High-impact releases like NFP, CPI, or FOMC decisions can cause displacement that moves through PDH or PDL aggressively. These moves often leave liquidity voids and displacement FVGs that become high-probability setups once the initial volatility settles. Do not trade these setups during the release itself. Wait for the dust to settle and the structure to clarify.
PDH and PDL in the ERL to IRL Cycle
PDH and PDL are External Range Liquidity (ERL) by definition. They sit at the boundaries of the prior day range. BSL at PDH and SSL at PDL are the external pools that price is drawn toward before reversing to fill Internal Range Liquidity.
The cycle works like this on an intraday basis. During the Asian session, price consolidates inside the prior day range. Internal imbalances (FVGs and order blocks from the prior day) may form inside that range. As London opens, price sweeps one of the PDH or PDL ERL targets. The sweep creates a displacement move. That displacement leaves a new FVG, which becomes the IRL draw for the next leg. Price retraces into the FVG and continues toward the opposing PDH or PDL.
Understanding where you are in this cycle before the session opens is what separates reactive trading from anticipatory trading. If PDL was swept during the Asian session with a bullish close above it, the IRL draw is toward any FVG formed during the impulse. Once that FVG is filled, the next ERL draw is toward PDH.
For the full ERL to IRL framework across all timeframes and all market conditions, the GhostTraders guide on External and Internal Range Liquidity walks through the complete methodology.
How to Trade PDH and PDL: The Sweep and Reversal Setup
This is the highest-probability PDH and PDL trade and the one that aligns most directly with institutional behaviour.
Step 1: Mark your PDH and PDL before the session opens. Do this on the daily chart, then transfer the horizontal lines to your intraday chart (1-hour or 15-minute). These levels are fixed for the entire day. Do not adjust them.
Step 2: Establish higher timeframe bias. Check the 4-hour and daily structure before the session begins. Is the broader trend bullish or bearish? A PDL sweep followed by a bullish reversal carries far more weight when the 4-hour trend is already bullish. A PDH sweep followed by a bearish reversal is strongest when the 4-hour trend is already bearish.
Step 3: Wait for the sweep. During the London or New York open window, watch for price to push beyond PDH or PDL. You are waiting for the candle to close back inside the prior range after the spike. A close back inside confirms the sweep is complete rather than a genuine breakout.
Step 4: Confirm on a lower timeframe. Drop to the 5-minute or 15-minute chart. Look for a Change of Character confirming the reversal is underway. After a PDH sweep, you want to see a bearish CHoCH: price breaking below a short-term higher low on the lower timeframe. After a PDL sweep, you want a bullish CHoCH: price breaking above a short-term lower high.
Step 5: Find the FVG entry. The sweep impulse almost always creates a Fair Value Gap on the lower timeframe. This FVG is your entry zone. Set a limit order at the Consequent Encroachment level (50% midpoint of the FVG). For a bearish reversal from PDH, this is a sell limit. For a bullish reversal from PDL, this is a buy limit.
Step 6: Stop and target. Place the stop beyond the sweep extreme. For a short from PDH sweep, the stop goes above the highest wick point of the sweep candle. For a long from PDL sweep, the stop goes below the lowest wick of the sweep candle. Target the midpoint of the prior day range as the first target, then the opposing PDL (for a short) or PDH (for a long) as the full target.
How to Trade PDH and PDL: The Breakout and Retest Setup
When price breaks PDH or PDL with genuine institutional momentum, the trade is not a reversal. It is a continuation trade on the retest.
How to confirm a genuine break: Multiple candles must close beyond PDH or PDL. Price should build structure on the new side of the level rather than immediately reversing. Volume should increase during the break (where volume data is available). There should be a displacement candle forming a FVG as price moves through the level.
The entry: After the initial break and expansion, wait for price to retrace back toward the broken level. A broken PDH becomes new support. A broken PDL becomes new resistance. When price returns to test the level, look for a bullish FVG or order block above the broken PDH for a long entry. Look for a bearish FVG or order block below the broken PDL for a short entry.
Stop and target: Stop goes below the retest candle structure for a long, above it for a short. Target the next significant liquidity level: the previous week high (PWH) for a long continuation above PDH, or the previous week low (PWL) for a short continuation below PDL.
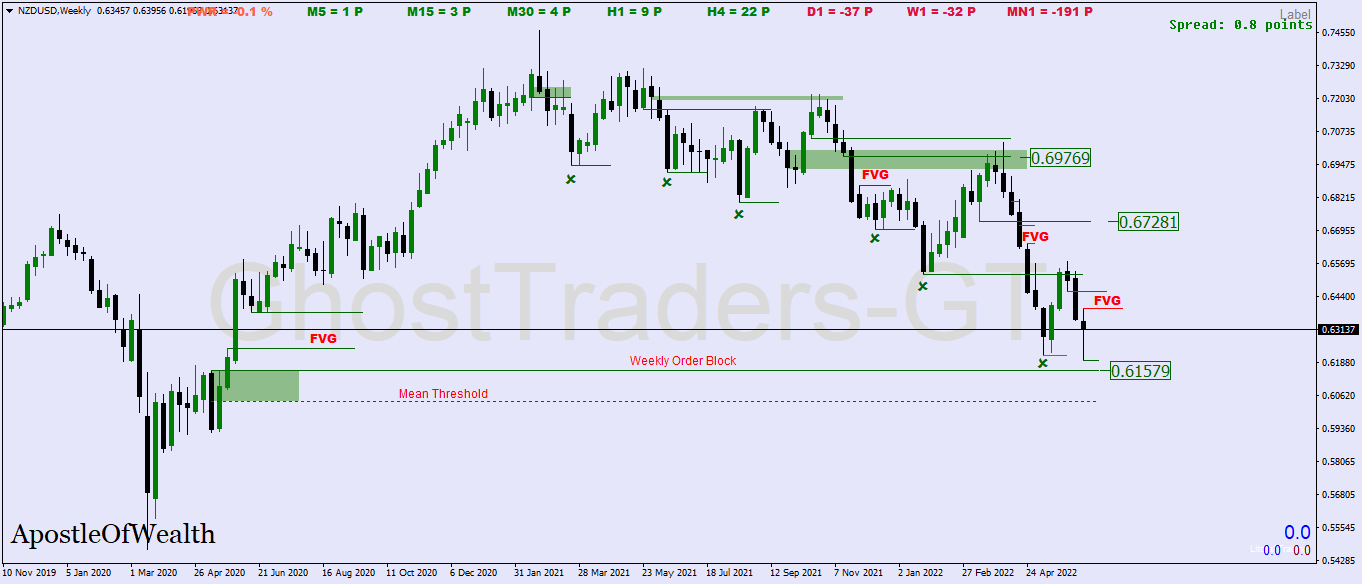
Stacking Confluence at PDH and PDL
PDH and PDL setups become significantly stronger when they align with other SMC reference points at the same price level.
Order block alignment. When PDH or PDL sits at the same level as a 4-hour or daily order block, the setup carries dual institutional weight. The order block marks where institutions originally entered. PDH or PDL marks where the retail liquidity is pooled. Both at the same level create a very high-probability reaction zone.
Fair Value Gap alignment. An unfilled FVG from a prior session that sits at or near PDH or PDL adds a third layer of confluence. Price draws toward the FVG for rebalancing, and the PDH or PDL provides the liquidity collection that precedes the FVG fill.
Premium and discount zones. A PDL sweep that occurs in the discount zone (below the 50% Fibonacci of the prior week range) is higher probability for a bullish reversal than a PDL sweep in the middle of the range. Similarly, a PDH sweep in the premium zone (above 50% of the prior week range) is higher probability for a bearish reversal. The Fibonacci filter removes lower-quality setups automatically.
Session kill zone timing. A PDH or PDL sweep that occurs within the London or New York kill zone carries more institutional weight than the same setup during the Asian session. Session timing is not optional for this strategy.
For the broader context of how kill zones and session timing amplify liquidity pool setups, the GhostTraders guide on liquidity pools in forex covers the full multi-timeframe approach.
PDH and PDL Across Multiple Timeframes
PDH and PDL are daily reference levels but the extension of this logic applies across multiple timeframes.
Previous Week High (PWH) and Previous Week Low (PWL) function identically to PDH and PDL but carry more institutional weight because the liquidity sitting at those levels has accumulated over five trading days rather than one. Sweeps of PWH or PWL are higher-conviction setups and often precede multi-day directional moves. When a PDH or PDL sweep aligns with PWH or PWL at the same price zone, the confluence is significant.
Previous Month High (PMH) and Previous Month Low (PML) are macro liquidity targets. Institutions plan around these levels on a quarterly basis. When monthly highs or lows get swept, the resulting move tends to be significant and sustained. The GhostTraders guide on Quarterly Shifts and IPDA Data Ranges explains how these macro liquidity levels fit into the institutional planning cycle.
On lower timeframes, the same logic applies to session highs and lows. The Asian session high and low function as intraday PDH and PDL equivalents during the London session. London session highs and lows function the same way during New York. Sweeps of these session levels produce the same BSL and SSL collection dynamics on a smaller timeframe scale.
Common Mistakes Traders Make
Entering the moment price touches PDH or PDL. The touch alone is not the trade. The sweep (close beyond the level) followed by the reversal is the trade. Entering on a touch without a sweep means you are trading before the liquidity event has even occurred.
Trading every sweep regardless of session. A PDH sweep at 3:00 AM during the Asian session on EUR/USD is a very different proposition from the same sweep at the London open. Session context determines whether institutional participation is present to follow through on the reversal.
Ignoring higher timeframe bias. A PDL sweep giving a bullish signal in a daily downtrend is a counter-trend setup. It can work with a confirmed daily CHoCH, but without that confirmation, you are trading against institutional momentum on the higher timeframe.
Using PDH and PDL as the only reason for a trade. The level is one piece of context. The FVG entry, the CHoCH confirmation, the session timing, and the higher timeframe structure all need to align. PDH and PDL alone do not make a setup. They tell you where to look. Everything else tells you whether to trade.
Missing the difference between a sweep and a rejection. A sweep closes beyond the level. A rejection approaches the level and turns without breaching it. Treating a rejection as a completed sweep leads to entering trades where the liquidity event has not yet occurred and the level may still be targeted for a genuine sweep later.
Not adjusting for the Asian session range. If the Asian session created a range significantly inside PDH and PDL, the more immediate liquidity targets are the Asian session high and low, not the wider daily levels. Trade the nearer levels first and extend to PDH and PDL once those are cleared.
The PDH and PDL Trade Checklist
Confirm every item before entering a trade from a PDH or PDL setup.
- Have I marked PDH and PDL on the chart before the session opened?
- Is the higher timeframe (4-hour or daily) structure in agreement with the trade direction?
- Did price sweep beyond the level with a candle close outside the prior range (sweep confirmed)?
- Am I trading during a London or New York kill zone window (not the Asian session)?
- Is there a CHoCH on the lower timeframe confirming the reversal after the sweep?
- Is there a valid FVG from the sweep impulse for a precise limit order entry?
- Does the PDH or PDL align with an order block or FVG from a prior session for added confluence?
- Is the setup in the discount zone (for longs from PDL) or premium zone (for shorts from PDH)?
- Is my stop placed beyond the sweep extreme, not at the PDH or PDL level itself?
- Does my target at the midpoint of the range or the opposing level give at least 2:1 reward?
Frequently Asked Questions
What is the previous day high and low in trading?
The previous day high (PDH) is the highest price reached during the prior trading session. The previous day low (PDL) is the lowest price from that same session. In traditional analysis, they are support and resistance levels. In ICT and Smart Money Concepts, they are liquidity pools where retail stop losses and pending orders accumulate, and where institutions consistently target at the start of each new session to collect orders before making the real directional move.
How do PDH and PDL work as BSL and SSL?
PDH is a Buy Side Liquidity (BSL) level because buy stop orders from short sellers and breakout buyers sit above it. When institutions want to sell short at size, they push price above PDH to trigger those buy orders and use them as counterparty for their sell. PDL is a Sell Side Liquidity (SSL) level because sell stop orders from long traders and breakout sellers sit below it. Institutions push price below PDL to collect those sell orders and use them to fill large long positions.
What is the difference between a PDH sweep and a PDH breakout?
A PDH sweep is when price spikes above the level, triggers the buy orders there, and closes back below PDH within a short number of candles. It signals a bearish reversal. A PDH breakout is when price moves above PDH and holds there, with subsequent candles building structure beyond the level. It signals bullish continuation. The key distinction is whether price closes and accepts above PDH or closes back below it.
What session is best for trading PDH and PDL?
London open (2:00 AM to 5:00 AM EST) and New York open (7:00 AM to 10:00 AM EST) produce the most reliable PDH and PDL setups. London frequently sweeps the Asian session range boundaries, which often align with PDH and PDL. The New York Judas Swing often sweeps the opposite side of the London move. The Asian session builds liquidity around these levels rather than collecting it.
How do I set my stop loss on a PDH or PDL sweep trade?
Place the stop beyond the extreme of the sweep candle, not at the PDH or PDL level itself. For a short trade after a PDH sweep, the stop goes above the highest wick point that printed during the sweep. For a long trade after a PDL sweep, the stop goes below the lowest wick of the sweep candle. Placing the stop at PDH or PDL itself puts you at risk of a second test of the level stopping you out before the reversal develops fully.
Can I use PDH and PDL in crypto and indices?
Yes. The same BSL and SSL mechanics that make PDH and PDL significant in forex apply in any liquid market. Equity indices, gold, Bitcoin, and Ethereum all show consistent price reactions at previous session highs and lows for the same reason: retail traders worldwide reference these levels, which means the orders accumulate there, which means institutions can and do target them for liquidity collection.
How do PWH and PWL relate to PDH and PDL?
Previous Week High (PWH) and Previous Week Low (PWL) function identically to PDH and PDL but carry greater institutional weight because the liquidity sitting at those levels has accumulated over five trading days. When a PDH sweep aligns with PWH at the same price zone, the resulting move is often larger and more sustained. Both are external range liquidity targets. PWH and PWL are the higher-timeframe version of the same concept.
Conclusion
The previous day high and low are two of the most reliable liquidity pool locations on any intraday chart. They are consistent, universally referenced, and carry the exact type of order clustering that institutions need to fill large positions at size. Every trading day, new stop losses accumulate above PDH and below PDL as the session progresses. Every new session, institutions have fresh opportunities to collect from those pools before establishing the real directional move.
Trading PDH and PDL with the SMC framework gives you the institutional context that traditional support and resistance analysis misses. The level is not where you enter because price might bounce. The level is where you wait for the sweep, confirm the reversal on a lower timeframe, and enter from the FVG that the sweep impulse created.
To build the complete context around PDH and PDL setups, these GhostTraders guides cover every related layer:
- What Is Liquidity in Trading: the full foundation of BSL, SSL, and how institutions use liquidity pools.
- Liquidity Pools in Forex: all eight pool types including session levels, equal highs and lows, and consolidation extremes.
- Liquidity Grabs: the single-candle sweep mechanics in full detail.
- External and Internal Range Liquidity: how PDH and PDL fit into the ERL to IRL cycle.
- Quarterly Shifts and IPDA Data Ranges: how macro liquidity targets at monthly and quarterly levels extend the same framework.
Risk Disclosure: Trading foreign exchange and financial derivatives carries a high level of risk and may not be suitable for all investors. All content on GhostTraders is for educational purposes only and does not constitute financial advice. Never trade with capital you cannot afford to lose. Author: Ndumiso Phelembe, Founder of GhostTraders, with over a decade of experience in institutional trading methodology.
