
Higher lows and lower highs are the two patterns that tell you everything about where price is heading next. Every trend, every reversal, and every decent entry starts with reading these correctly. If you can map them on a chart, you can trade with the market instead of guessing against it.
This guide breaks down exactly what higher highs, higher lows, lower highs, and lower lows mean, how to spot them across different timeframes, how smart money uses them to hunt liquidity, and how to build entries around them on forex, indices, and gold.
Key Takeaways
- Higher highs (HH) and higher lows (HL) confirm a bullish trend. Buyers are in control.
- Lower highs (LH) and lower lows (LL) confirm a bearish trend. Sellers are in control.
- When a higher low breaks, the uptrend is damaged. A lower high that follows confirms a market structure shift from bullish to bearish.
- The same logic applies in reverse. A broken lower high followed by a higher low signals a shift from bearish to bullish.
- Higher lows and lower highs are liquidity zones. Institutions target these areas to fill large orders.
- The higher the timeframe, the more reliable the structure. A break on the 15 minute doesn’t carry the weight of a break on the daily.
What Are Higher Highs and Higher Lows?
A higher high is a peak that forms above the previous peak. A higher low is a pullback low that forms above the previous pullback low. When you see both happening in sequence, you’re looking at a clean uptrend.
The sequence tells you something important. Buyers are pressing harder than sellers. Every time price pulls back, buyers step in sooner than they did before. That’s how momentum keeps stacking.
In a bullish market structure you’ll see:
- Higher High (HH): price breaks above the most recent swing high, confirming buyers are willing to pay more.
- Higher Low (HL): price pulls back but bottoms out above the most recent swing low, showing buyers are stepping in earlier.
- Together they form an ascending channel of impulses and corrective retracements.
A practical example. On EURUSD during a London session rally, you watch price take out the Asian session high (HH), pull back into a fair value gap or bullish order block, and bottom out above the previous swing low (HL). That combination tells you the bullish leg is still alive and the pullback is a buying opportunity, not a reversal.
What Are Lower Highs and Lower Lows?
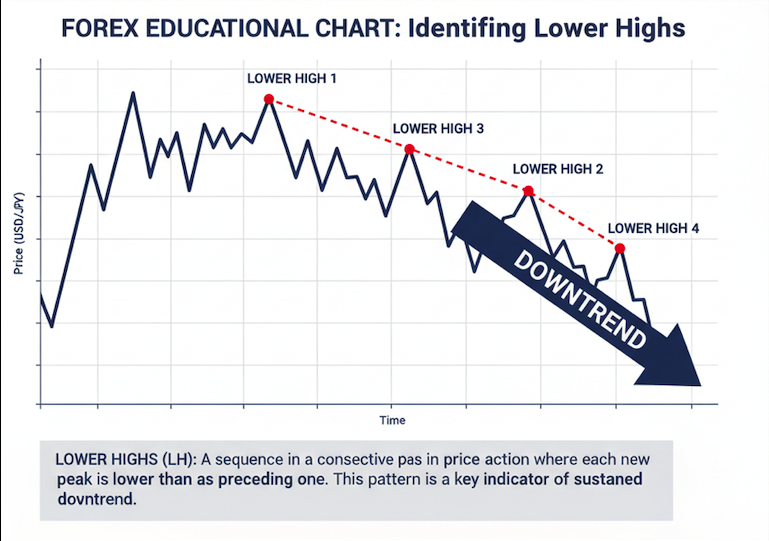
A lower high is a peak that forms below the previous peak. A lower low is a pullback low that forms below the previous pullback low. Together, they define a bearish trend.
Sellers are in charge. Every rally runs out of fuel earlier than the last one. Every selloff stretches further down. The lower high and lower low sequence is the downward mirror of what buyers do in an uptrend.
In a bearish market structure, you’ll see:
- Lower High (LH): price rallies but fails to reach the previous high, showing buyers are losing strength.
- Lower Low (LL): price drops below the previous swing low, confirming sellers are in control.
- Together they produce a descending staircase pattern.
Example. On GBPJPY after a New York session reversal, price pushes up to a premium zone, forms a lower high, and drops to break the previous session low. That confirms the bearish leg is intact and any rally back into the premium area is a selling opportunity.
How to Spot HH, HL, LH, and LL on a Chart
Most traders see structure wrong because they’re looking at every candle wick. Structure is read from swing points, not individual candles.
A swing high forms when a candle prints a high that is higher than the candles on either side of it. A swing low forms when a candle prints a low that is lower than the candles on either side of it. Those are your reference points.
Mark your swing points from left to right. Then ask two questions:
- Is each new swing high higher or lower than the one before it?
- Is each new swing low higher or lower than the one before it?
That’s it. If both swings are stepping up, you have an uptrend. If both are stepping down, you have a downtrend. If one is stepping up and the other is stepping down, you have a consolidation or a possible structure shift brewing.
You can use a zigzag indicator to automate this, but most serious price action traders mark structure by hand. It forces you to actually read the chart instead of trusting a tool.
Internal Structure vs External Structure
This is the difference between a trader who reads structure at a glance and a trader who gets chopped up inside ranges.
External structure is the major swing highs and lows that define the bigger trend. These are the points that matter on a daily or 4 hour chart.
Internal structure is the smaller highs and lows that form between two external points. Think of internal structure as the detail work inside a larger leg.
If you’re buying into an uptrend, the external structure gives you bias. The internal structure gives you refinement. A higher low on the 15 minute is an internal signal. A higher low on the 4 hour carries far more weight.
Beginners lose money because they trade internal structure as if it were external structure. A small lower high on the 5 minute isn’t a reversal when the daily is still printing higher highs. It’s noise inside the bigger leg.
Market Structure Shift: When HH and HL Break Down
A market structure shift, also written as MSS or change of character (CHoCH), happens when the pattern of higher highs and higher lows breaks. The sequence looks like this:
- Price has been making HH and HL
- A new low forms that dips below the previous higher low
- That’s the first crack in the uptrend
- If price then fails to make a new high and instead prints a lower high, the shift is confirmed
You’ve just gone from bullish structure to bearish structure. The market is telling you something changed.
The reverse works the same way. In a downtrend, when price breaks above the last lower high, the bearish structure is damaged. If a higher low follows, you have a potential bullish shift.
Smart money traders look for these shifts at premium and discount zones. A shift in a discount zone after a stop hunt often signals the start of a new leg up. A shift in a premium zone after liquidity is swept signals the start of a new leg down. This is where you want to be positioned.
Why Higher Lows and Lower Highs Are Liquidity Zones
This is what most retail trading articles skip over. The reason higher lows and lower highs matter isn’t just because they confirm a trend. They exist because that’s where stop losses sit.
Traders who buy an uptrend will park stops below the last higher low. Traders who short a downtrend will park stops above the last lower high. Those clusters of stops are liquidity. Institutions need liquidity to fill large orders, so they engineer price to run into those zones.
When you watch a wick sweep below a higher low and then close back above it, that’s a liquidity sweep. The stops below got tagged, the orders got filled, and price often reverses hard. The same happens above lower highs in downtrends.
If you understand this, you stop placing your stop loss exactly at the obvious level and start placing it where it actually belongs: beyond the liquidity zone, not inside it.

Timeframes: Which One Should You Use?
Structure exists on every timeframe. What changes is how much weight each one carries.
- 1 minute to 15 minute: scalping and intraday entries. Structure breaks fast and reverses fast. Use these only for refinement, never for bias.
- 1 hour to 4 hour: day trading and swing entries. This is where most kill zone moves play out on forex and gold.
- Daily: swing trading and positional bias. A break of structure on the daily is significant and often marks the start of a multi-week move.
- Weekly and monthly: institutional bias. A daily HL holding a weekly HL is a high confluence setup.
The rule is simple. Your bias comes from the higher timeframe. Your entry comes from the lower timeframe. If the 4 hour is in a clean uptrend with HH and HL, you look for a higher low on the 15 minute inside a discount zone to enter long.
How to Trade Higher Lows and Lower Highs
The structure itself isn’t the trade. The trade is what you do at the structure.
Entering long at a higher low
- Confirm the higher timeframe trend is bullish (HH and HL on 4 hour or daily)
- Wait for price to pull back to a higher low area that lines up with a point of interest, such as a bullish order block, fair value gap, or previous swing low
- Look for a lower timeframe shift. A break of the recent internal lower high confirms buyers are stepping back in
- Enter on the retest of that broken structure, or on the fair value gap inside the zone
- Stop loss goes below the higher low, ideally beyond liquidity so you don’t get swept
- Target the next higher high or an external liquidity pool above
Entering short at a lower high
- Confirm the higher timeframe trend is bearish (LH and LL on 4 hour or daily)
- Wait for price to rally into a lower high area with a premium point of interest
- Look for a lower timeframe shift down. The internal higher low gets taken out
- Enter on the retest of the broken structure, or on the fair value gap inside the zone
- Stop loss goes above the lower high, beyond the liquidity that sits just above it
- Target the next lower low or an external liquidity pool below
This is how you combine structure with smart money concepts instead of just drawing lines and hoping.
Common Mistakes Traders Make
These are the traps that blow up beginner accounts over and over.
Confusing a pullback with a reversal. A single lower high on a 5 minute inside a 4 hour uptrend is not a reversal. It’s a pullback. Zoom out before you flip bias.
Drawing structure on every candle wick. Not every wick is a swing point. Focus on the swings that actually produced a meaningful reaction.
Ignoring the higher timeframe. If the daily is bearish, don’t build longs off a 5 minute higher low. Alignment between timeframes matters.
Placing stops inside the liquidity zone. If every retail trader’s stop is at the exact swing low, that’s the easiest place for your stop to get hunted. Go beyond it.
Trading every break of structure. Not every break is valid. A weak break with low momentum that fails to close decisively is usually a false move. Wait for the candle to close.
Higher Highs and Lower Lows in Forex
Forex pairs respect structure beautifully when you read them on the right timeframe. Pairs with clean trending behaviour like GBPJPY, USDJPY, and gold (XAUUSD) give you the cleanest HH, HL, LH, LL sequences. Ranging pairs like EURGBP or USDCHF produce more false breaks and need stricter filters.
Session timing matters. The London kill zone (02:00 to 05:00 NYT UTC-5) and the New York kill zone (07:00 to 10:00 NYT UTC-5) are where most structural moves complete. If you’re waiting for a higher low to form on EURUSD, the London open is usually where price delivers it. If you’re waiting for a lower high to form on GBPUSD, the New York session often produces the rejection.
Gold in particular moves aggressively off higher lows during the New York session, especially on days carrying high impact US data like CPI, NFP, or FOMC.
Frequently Asked Questions
What do higher highs and lower lows mean in trading?
Higher highs mean price is making progressively higher peaks, confirming buyers are in control. Lower lows mean price is making progressively lower bottoms, confirming sellers are in control. Higher highs paired with higher lows equal an uptrend. Lower highs paired with lower lows equal a downtrend.
Are higher lows bullish or bearish?
Higher lows are bullish. They show that sellers cannot push price as low as they did on the previous pullback, meaning buyers are stepping in earlier and with more conviction.
Are lower highs bullish or bearish?
Lower highs are bearish. They show that buyers cannot push price as high as they did on the previous rally, meaning sellers are defending lower prices and bearish momentum is intact.
What happens when a higher low is broken?
A broken higher low is the first warning that the uptrend is weakening. If a lower high then forms, the structure has shifted from bullish to bearish. This is known as a market structure shift or change of character.
Can I trade only on higher lows and lower highs?
You can, but you shouldn’t trade them in isolation. Combine them with a point of interest like an order block or fair value gap, a liquidity sweep, and a confirmation on the lower timeframe. Structure alone gives you direction. You still need entry logic, stops, and targets.
What timeframe is best for spotting HH and HL?
For swing trading, the 4 hour and daily give the cleanest structure. For day trading, the 1 hour and 15 minute work well once you have higher timeframe bias. The 1 minute and 5 minute are too noisy to rely on for structure reading alone.
What is the difference between internal structure and external structure?
External structure is the major swing highs and lows that define the bigger trend. Internal structure is the smaller swings that form inside a single leg of the bigger trend. External gives bias. Internal gives refinement.
Final Thoughts
Higher highs, higher lows, lower highs, and lower lows are the foundation every other tool in trading sits on top of. Before you learn a single indicator, get this right.
Price does one of two things. It trends or it consolidates. Structure tells you which one, and it tells you the moment that changes. If you can mark structure cleanly and spot when it shifts, you already have more than most traders who’ve been in the game for years.
The next step is learning what to do at those structural levels. How to combine them with order blocks, fair value gaps, kill zone timing, and liquidity. That’s where the edge lives, and that’s what we teach inside the GhostTraders mentorship.
