
Liquidity grabs are one of the fastest, most decisive signals you will ever see on a chart. One candle. A long wick. A sharp rejection. And if you know what you are looking at, a complete trade setup in front of you. Most retail traders see that wick and think “volatility.” Smart money traders see it and think “institutions just collected what they needed.”
This guide covers exactly what liquidity grabs are, how Buy Side Liquidity (BSL) and Sell Side Liquidity (SSL) grabs work, how to tell a valid grab from a fake wick, and how to build a full trade setup from the moment a grab confirms.
What You Will Learn in This Guide
- The exact single-candle structure that defines a valid liquidity grab
- How BSL grabs and SSL grabs differ and what each one signals for your next trade
- Why grabs happen at specific price levels and how ERL and IRL explain it
- How to tell a genuine grab from a wick that keeps going in the wrong direction
- A step-by-step trade plan using the grab as your starting point
- The most common mistakes traders make when they try to trade liquidity grabs
What Is a Liquidity Grab?
A liquidity grab is a single-candle event where price spikes aggressively through a key level, triggers the stop losses and pending orders sitting there, and then closes back inside the prior range within the same candle. The result is a candle with a long wick and a relatively small body. That wick is the evidence. It marks the exact price where institutions entered the market using the orders they just triggered as the other side of their trade.
The word “grab” is deliberately precise. Unlike a liquidity sweep, which can unfold over several candles and include a brief consolidation beyond the level, a grab happens fast. Price reaches for the liquidity, collects it, and snaps back before the candle even closes. That speed and aggression is what makes grabs so recognisable and, when valid, so tradeable.
In Smart Money Concepts (SMC) and ICT trading, liquidity grabs are considered one of the clearest signs of institutional involvement at a specific price level. They answer a question that most retail traders never think to ask: why did that wick form exactly there?
Why Liquidity Grabs Happen: The Institutional Logic
To understand why liquidity grabs form, you need to understand the problem large institutions face every time they want to enter the market.
A bank or hedge fund cannot simply click “buy” for a position worth hundreds of millions. Doing that in one go would push price significantly against them before their order is even filled. So instead, they manufacture the conditions to get the fill they need at the price they want.
Here is how that works in practice. Retail traders are predictable. They place stop losses at obvious levels: just below recent lows for long positions, just above recent highs for short positions. Over time, those stop losses pile up at the same general areas. For institutions, those clusters of stop orders are fuel. They are the liquidity needed to fill a large position at scale.
An institution that wants to enter a large long position needs sellers to take the other side. The most efficient way to manufacture those sellers is to drive price below a recent low, trigger every stop loss sitting there, and use that wave of sell orders as the liquidity to buy into. The spike below the low is the grab. The wick is the footprint. The rejection back above is the institution repositioning in the direction it actually wants to move.
That is why grabs are not random. They happen at levels where liquidity has accumulated, because that is exactly where institutions need to go to get their orders filled.
For a broader understanding of how institutions view and exploit liquidity across all market conditions, the GhostTraders guide on what liquidity is in trading covers the full foundational framework.
Buy Side Liquidity (BSL) and Sell Side Liquidity (SSL) Explained
Every liquidity grab targets one of two types of liquidity. Knowing which one was grabbed tells you the direction of the trade that follows.
Buy Side Liquidity (BSL)
BSL is the cluster of pending buy orders resting above key highs on a chart. These come from two groups. First, short sellers who placed stop losses above a high to limit their losses if price reverses against them. Second, breakout traders who placed pending buy orders above the high expecting a continuation higher. Both groups have orders at roughly the same level. When price spikes above that high and closes back below it, that is a bearish liquidity grab. Institutions used the BSL to sell into the market at size. The grab of BSL is a bearish signal.
Sell Side Liquidity (SSL)
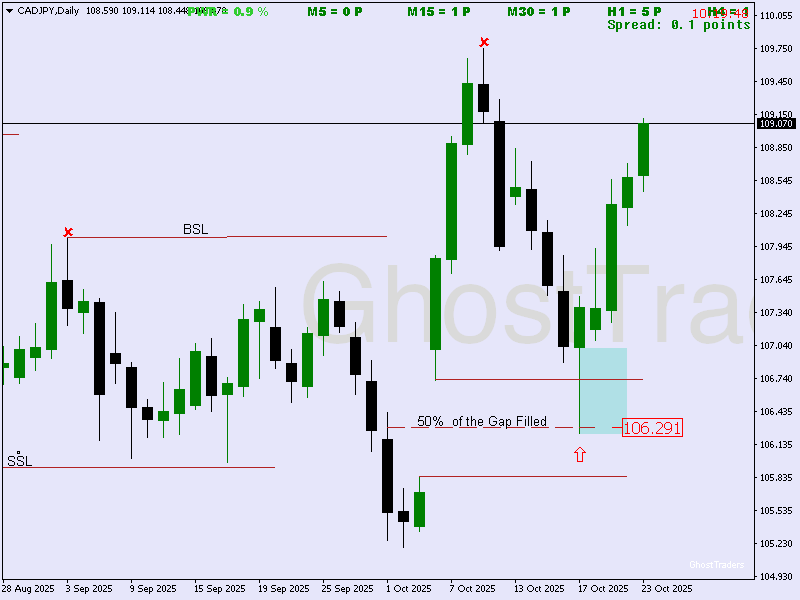
SSL is the cluster of pending sell orders resting below key lows. These come from long traders who placed stop losses below a low, and from breakout sellers who placed pending sell orders below expecting a continuation lower. When price spikes below that low and closes back above it, that is a bullish liquidity grab. Institutions used the SSL to buy into the market at size. The grab of SSL is a bullish signal.
The logic is the opposite of what breakout trading teaches. A spike above a high is not a buy signal. It is a potential sell signal. A spike below a low is not a sell signal. It is a potential buy signal. This inversion is what makes liquidity grabs so powerful for traders who understand the mechanics.
Bullish Liquidity Grabs: Grabbing SSL
A bullish liquidity grab forms when price spikes below a key low, triggers the sell stops resting there, and snaps back above that low within the same candle. The resulting candle has a long lower wick and a small body positioned near the top of the candle. This pattern looks similar to a Dragonfly Doji or a bullish hammer, but its significance comes from context, not just the candle shape.
What the wick tells you: The lower wick represents the range of price where institutions were aggressively buying into the sell stops being triggered. The longer the wick relative to surrounding candles, the more significant the level and the more decisive the institutional entry.
Where to look for SSL grabs: The most reliable bullish liquidity grabs form at previous swing lows, equal lows (where price has tested the same low multiple times), the previous day’s low, the previous week’s low, and consolidation zone lows where stop orders have visibly accumulated over time.
What happens next: After a valid SSL grab, price should move decisively higher. Your job is not to enter on the grab candle itself. Instead, wait for confirmation that the reversal is real before committing capital. The process for that confirmation is covered in the step-by-step trade section below.

alt: Bullish liquidity grab at sell side liquidity showing the long lower wick candle pattern on a forex chart
Bearish Liquidity Grabs: Grabbing BSL
A bearish liquidity grab forms when price spikes above a key high, triggers the buy stops resting there, and closes back below that high within the same candle. The resulting candle has a long upper wick and a small body near the bottom of the candle. This looks similar to a Gravestone Doji or a shooting star, but again, context is everything.
What the wick tells you: The upper wick represents the range where institutions were aggressively selling into the buy stops being triggered. The larger the wick, the more decisive the selling pressure at that level.
Where to look for BSL grabs: The most reliable bearish grabs form at previous swing highs, equal highs, the previous day’s high, the previous week’s high, and the upper extremes of established consolidation ranges.
What happens next: After a valid BSL grab, price should move decisively lower. The grab candle sets your bearish bias. Confirmation through a lower-timeframe Change of Character (CHoCH) is what turns that bias into an actual entry.

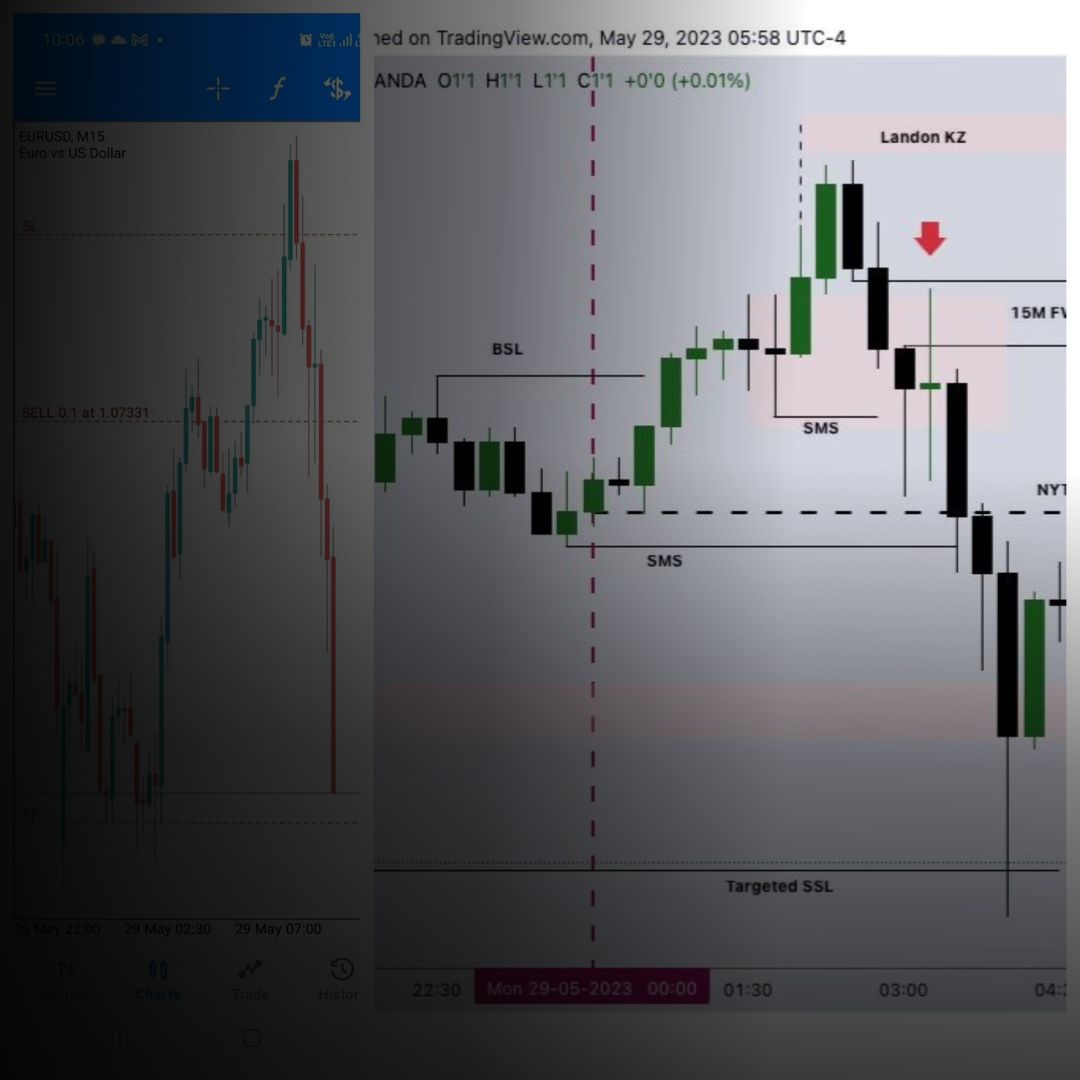
alt: Bearish liquidity grab at buy side liquidity showing the shooting star candle pattern on a forex chart
Liquidity Grabs and the ERL to IRL Cycle
This is the section that most liquidity grab articles skip, and it is the most important context for trading them consistently. A liquidity grab does not happen in isolation. It is part of a larger cycle that governs how price moves between different types of liquidity.
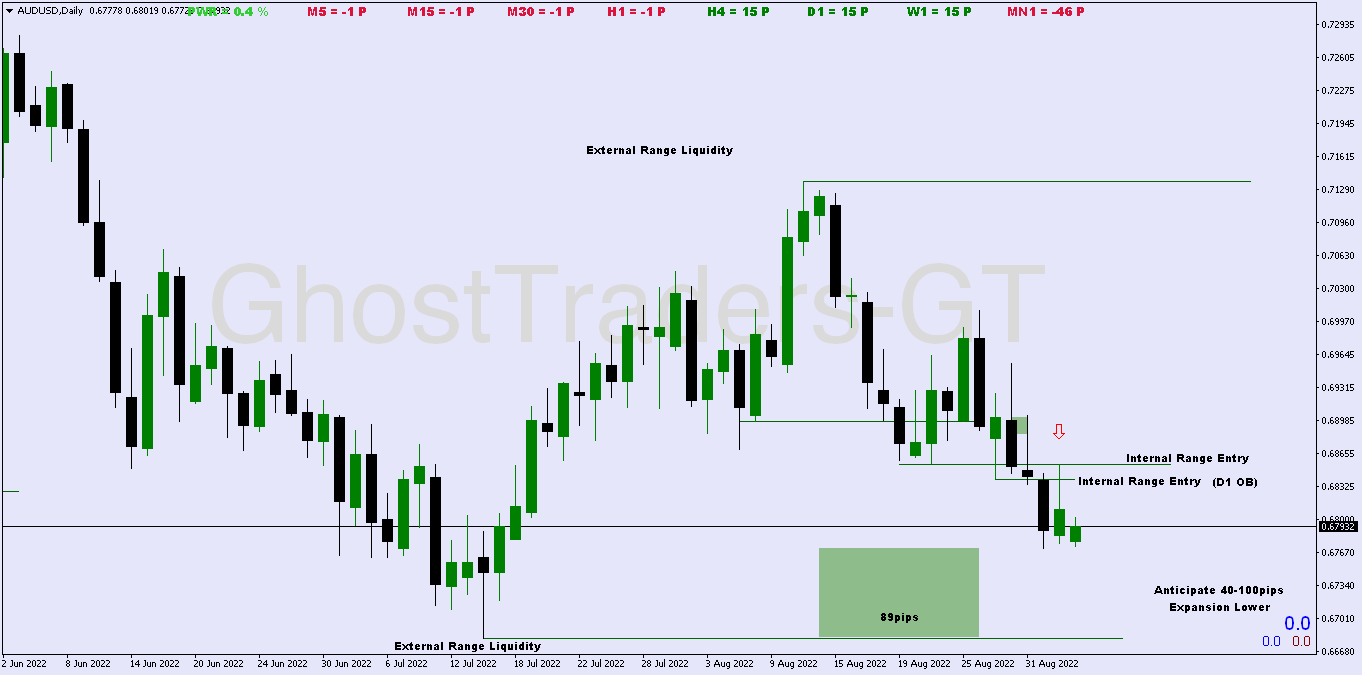
External Range Liquidity (ERL) is the liquidity sitting at previous swing highs and lows, which is exactly where BSL and SSL accumulate. A liquidity grab is the aggressive, single-candle version of taking ERL. When price grabs SSL below a swing low, it is taking the external range liquidity at that boundary.
Internal Range Liquidity (IRL) is the liquidity sitting inside the defined price range. This is primarily found in the form of Fair Value Gaps (FVGs) and order blocks. After ERL is taken via a grab, price does not just reverse randomly. It is drawn toward the next IRL target. That FVG created during the impulse move following the grab is the first draw on internal liquidity.
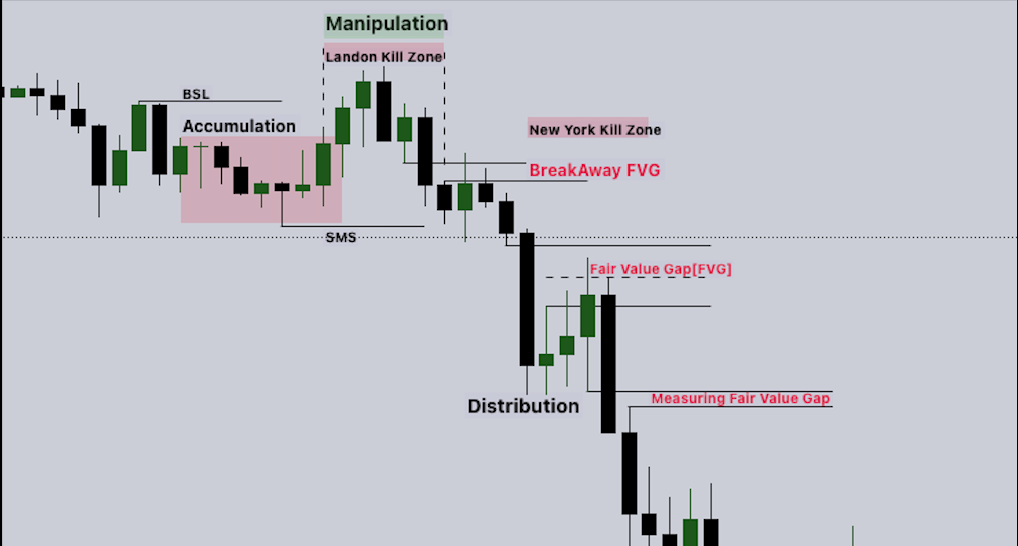
The cycle in practice: Price grabs SSL at a swing low (ERL taken). Price reverses impulsively upward, creating a bullish FVG in the process (IRL formed). Price retraces into that FVG (IRL being drawn toward). Price resumes higher toward the next swing high (BSL above, which is the next ERL target). That BSL above gets grabbed (ERL taken again). The cycle repeats.
Understanding this cycle tells you two critical things. First, the grab confirms the directional move. Second, the FVG created immediately after the grab is your entry point. You are not guessing where to enter. The market has already shown you.
For a complete breakdown of how this ERL to IRL rotation works across multiple timeframes, the GhostTraders guide on External and Internal Range Liquidity walks through the full framework including how to define your range and identify which liquidity is being targeted next.
Valid Grab vs Fake Wick: How to Tell the Difference
Not every long-wick candle at a key level is a genuine liquidity grab. Some are weak spikes that fail and price continues beyond the level. Knowing how to filter the valid ones from the noise is what separates this from a random wick-trading strategy.
The close is everything. A valid grab requires the candle to close back inside the prior range, on the correct side of the level that was breached. A bullish grab must close above the low that was spiked. A bearish grab must close below the high that was spiked. If the candle closes beyond the level, it is not a confirmed grab. It may be the beginning of a genuine breakout instead.
The wick should be proportionally significant. A long wick that is larger than the surrounding candles carries more weight than a minor wick that barely extends beyond the level. The wick size reflects the urgency of the institutional order flow at that level. A decisive, aggressive wick shows more institutional intent than a small extension.
The level must have visible liquidity. A grab at a level nobody was watching is less meaningful than a grab at an obvious swing low where stops have been accumulating. Equal lows are the strongest grab targets because everyone can see them, which means the stop orders piled there are larger and the resulting move after collection is stronger.
Volume context helps. On pairs where volume data is available, a spike in volume at the moment of the grab confirms that a large number of orders were triggered. That volume confirmation adds weight to the setup.
Lower-timeframe confirmation is required before entry. A grab sets the bias. A Change of Character (CHoCH) on the lower timeframe confirms the reversal is real. Without the CHoCH, you are entering on assumption rather than confirmation.
Liquidity Grabs vs Liquidity Sweeps
Since these two concepts are frequently confused, here is the clear distinction.
| Feature | Liquidity Grab | Liquidity Sweep |
|---|---|---|
| Duration | Single candle | Multiple candles |
| Price action | Spikes through the level and closes back inside within one candle | Moves through the level, sometimes consolidates briefly, then reverses |
| Candle signature | Long wick, small body. Dragonfly or Gravestone Doji type | Series of candles, close back inside range takes longer |
| Speed | Fast and aggressive | Slower, requires more patience |
| Confirmation timing | Faster. The candle close is your first confirmation | Slower. Need to see price reclaim the level over several candles |
| Reliability at higher timeframes | Very high. Daily and 4-hour grabs carry strong institutional weight | High, but more common on lower timeframes due to multi-candle structure |
Both describe the same fundamental event: price targets a liquidity level, collects the orders there, and reverses. The grab is the sniper version. The sweep is the longer range version. Both are valid setups when they occur at the right levels with the right confluence.
For a full breakdown of how liquidity sweeps work and how to trade them using the same ERL to IRL framework, the GhostTraders guide on liquidity sweeps in trading covers the full step-by-step approach.
How to Trade a Liquidity Grab Step by Step
Step 1: Mark Your BSL and SSL Levels
Before any grab can happen, you need to know where the liquidity is sitting. On your working timeframe (4-hour or daily for the most reliable setups), identify the recent swing highs where BSL is resting and the recent swing lows where SSL is accumulating. Pay extra attention to equal highs and equal lows because those are the premium targets for institutional grabs.
Step 2: Identify the Grab Candle
Watch for price to spike through one of your marked levels and close back inside the range within the same candle. The candle must have a clearly disproportionate wick relative to its body and to the surrounding candles. Mark the extreme of the wick as the liquidity level that was taken. This is your reference point for stop placement.
Step 3: Confirm Your Directional Bias
A grab of SSL sets a bullish bias. A grab of BSL sets a bearish bias. Write this down before you look at a lower timeframe. The bias is set by the grab, and every subsequent decision should align with it. Do not let lower-timeframe noise talk you out of a grab that happened at a significant level with a clean candle structure.
Step 4: Drop to a Lower Timeframe and Wait for CHoCH
Move to a timeframe one or two levels below your working chart. After an SSL grab on the 4-hour, go to the 1-hour or 15-minute. After a daily grab, go to the 4-hour. Watch for a Change of Character, which is price breaking a short-term structural point in the direction of your bias. For a bullish setup, that means price breaks above a short-term lower high. For a bearish setup, price breaks below a short-term higher low. This CHoCH is your confirmation that the reversal from the grab is real and underway.
Step 5: Find the FVG Entry from the Impulse Move
The aggressive move that followed the grab almost always creates a Fair Value Gap. This FVG is your Internal Range Liquidity target and your entry zone. Set a limit order at the FVG level, specifically at the Consequent Encroachment point (the 50% midpoint of the gap) for the best risk-to-reward. Wait for price to retrace into that zone.
Step 6: Set Your Stop and Target
Place your stop loss beyond the extreme of the grab wick. For a bullish trade, the stop goes below the lowest point of the wick that grabbed SSL. For a bearish trade, the stop goes above the highest point of the wick that grabbed BSL.
Your primary target is the opposing liquidity level. If you entered long after an SSL grab, the target is the BSL resting above. If you entered short after a BSL grab, the target is the SSL resting below. This completes one full rotation of the ERL to IRL to ERL cycle.
Minimum target: 2:1 risk-to-reward. With a clean grab at a significant level, a CHoCH confirmation, and an FVG entry, setups regularly deliver 3:1 or better when allowed to run.
Step 7: Manage the Trade
Once price moves 1R in your favour, move the stop to break even. Let the position run toward the opposing liquidity target without micromanaging every candle. Institutional moves that begin from a genuine grab tend to follow through cleanly toward the next ERL. Premature exits destroy the risk-to-reward that makes this strategy worth trading.
Liquidity Grabs and Order Blocks: The Setup Inside the Setup
This is a layer of confluence that most liquidity grab guides do not cover. The grab candle itself frequently functions as an order block.
Here is why. An order block in SMC terms is the last opposing candle before a strong directional move that breaks market structure. In many cases, the candle that forms a liquidity grab IS that last opposing candle. The institution entered aggressively within that candle, driving price through the liquidity level and then reversing. That candle body now marks the zone where institutional buy or sell orders were executed.
When price returns to that candle body zone later (not the wick, but the body of the grab candle itself), it is returning to an area of genuine institutional interest. This makes the grab candle body a secondary entry point if the first FVG entry is missed.
The practical result: after a bullish grab and a CHoCH confirmation, you have two potential entries. The first is the FVG created by the impulse move. The second is the body of the grab candle itself if price retraces that far. Both are institutional reference points. Both have logical stop placement (below the grab wick) and clear targets (opposing BSL). The FVG entry is tighter and usually offers better risk-to-reward. The grab candle body entry is wider but still valid as a secondary opportunity.
Common Mistakes Traders Make With Liquidity Grabs
Entering on the grab candle itself
The candle is still forming. Price can extend further than you expect. Entering before the candle closes and confirms back inside the range is guessing, not trading. Wait for the close.
Skipping the CHoCH confirmation
A grab sets a bias. It does not guarantee a reversal. Sometimes price grabs a level and continues in the same direction after a brief pause. The CHoCH on the lower timeframe is the filter that separates valid reversals from failed grabs. Trading without it means you will catch the failed ones along with the good ones, which destroys your win rate.
Trading grabs on low timeframes without higher-timeframe context
A grab on a 5-minute chart at a random level is noise. A grab on the 4-hour chart at a level that also aligns with the previous week’s low, during the London open session, with the daily bias already established as bullish, is a completely different proposition. The timeframe and context of the grab determine its significance.
Ignoring the ERL and IRL context
Trading a grab without knowing whether it is taking ERL or whether price is somewhere between IRL targets puts you at risk of fighting the larger directional draw. If price is being drawn toward an unmitigated FVG below the current level, a grab at a minor high above that draw is a low-probability trade regardless of how clean the wick looks.
Setting the stop inside the wick
If price grabbed below a low, your stop needs to be below the lowest point of that wick, not at the low itself. Tight stops inside the wick zone get hit by normal price fluctuation before the reversal gets going. Give the stop room to breathe beyond the actual grab extreme.
Trading without kill zone alignment
Grabs that happen during high-volume sessions (London open, New York open) are far more reliable than grabs during the Asian session or the New York lunch hour. Volume matters because institutions need active participation to fill their orders. A grab in a thin market lacks the follow-through that makes the post-grab move worth trading.
The Liquidity Grab Trade Checklist
Before entering any trade from a liquidity grab, confirm every item below.
- Is the grab at a clearly defined BSL or SSL level (swing high/low, equal highs/lows, PDH/PDL, PWH/PWL)?
- Did the candle close back inside the prior range after spiking through the level?
- Is the wick proportionally larger than surrounding candles, showing genuine aggression?
- Is my directional bias clearly set by the grab (bullish after SSL grab, bearish after BSL grab)?
- Have I confirmed a CHoCH on a lower timeframe?
- Is there a valid unmitigated FVG from the impulse move to use as my entry zone?
- Is my stop placed beyond the extreme of the grab wick, not at the level itself?
- Does the opposing BSL or SSL give me at least 2:1 risk-to-reward as a target?
- Am I trading during a kill zone with sufficient volume behind the move?
- Does this align with the broader ERL to IRL directional cycle on the higher timeframe?
If any of these are not clearly confirmed, the setup is not ready.
Frequently Asked Questions
What is a liquidity grab in trading?
A liquidity grab is a single-candle event where price spikes aggressively through a key high or low, triggers the stop losses and pending orders sitting there, and closes back inside the previous range within the same candle. The long wick left behind is the evidence of institutional order collection at that level. A grab at SSL is bullish. A grab at BSL is bearish.
What does a liquidity grab look like on a chart?
It looks like a candle with a long wick and a small body. A bullish grab at SSL produces a candle with a long lower wick and a body sitting near the top of the candle range, similar to a Dragonfly Doji or bullish hammer. A bearish grab at BSL produces a candle with a long upper wick and a body near the bottom, similar to a Gravestone Doji or shooting star. The key is not the candle shape alone but the context: it must occur at a genuine BSL or SSL level with the close back inside the range.
What is the difference between a liquidity grab and a liquidity sweep?
Both target the same BSL and SSL levels, but the timing and structure differ. A grab happens within a single candle: price spikes through the level and closes back inside within that one bar. A sweep unfolds over multiple candles and sometimes includes a brief consolidation beyond the level before reversing. Both are valid setups. The grab is faster and more aggressive. The sweep requires more patience for confirmation.
How do you trade a liquidity grab?
Mark your BSL and SSL levels before price reaches them. When a grab occurs, confirm the candle closes back inside the prior range. Drop to a lower timeframe and wait for a Change of Character (CHoCH) confirming the reversal. Find the Fair Value Gap formed by the impulse move following the grab and set a limit entry at the 50% midpoint of that gap. Place your stop beyond the extreme of the grab wick and target the opposing liquidity level.
Do liquidity grabs always lead to reversals?
No. Some grabs fail and price continues beyond the level. The close of the candle back inside the range is the first filter. The CHoCH on the lower timeframe is the second and more important filter. Without a confirmed structure shift, you are trading on the assumption that the reversal will follow. The CHoCH turns that assumption into a confirmed trade.
What timeframes are best for trading liquidity grabs?
Identify your grab levels on the 4-hour or daily chart. Those timeframes carry the most institutional weight because the liquidity sitting at those levels has accumulated over longer periods and is therefore larger. Use the 1-hour chart for CHoCH confirmation and FVG identification. Use the 15-minute chart for precise entry timing within the FVG zone.
How do liquidity grabs connect to External and Internal Range Liquidity?
A liquidity grab is the aggressive, single-candle version of price taking External Range Liquidity (ERL). ERL sits at previous swing highs and lows, which is exactly where BSL and SSL accumulate. When a grab takes that ERL, the next directional draw shifts toward Internal Range Liquidity (IRL), specifically the Fair Value Gap created by the move. That FVG is your entry. For a full explanation of how the ERL to IRL cycle works across timeframes, see the GhostTraders guide on External and Internal Range Liquidity.
How do I use liquidity grabs to build my trading bias?
After a grab of SSL, your bias is bullish. After a grab of BSL, your bias is bearish. You hold that bias until a higher-timeframe structural shift tells you it has changed. Within that bias, you only look for setups in the direction of the grab. This keeps you aligned with institutional order flow rather than fighting it. For a detailed breakdown of how to build and maintain a liquidity-based directional bias, the GhostTraders guide on Liquidity-Based Bias walks through the full process including how quarterly shifts and IPDA data ranges affect which liquidity is being targeted.
Conclusion
Liquidity grabs are the clearest single-candle evidence of institutional activity you will find on a chart. One wick at the right level tells you exactly where large participants entered, what direction they are positioned, and where they are likely to take price next.
The formula is straightforward. Find the BSL and SSL before price gets there. Watch for the single-candle grab with a close back inside the range. Confirm the reversal with a lower-timeframe CHoCH. Enter at the FVG formed by the impulse that followed. Stop beyond the wick. Target the opposing liquidity.
What makes this work consistently is not just the grab itself. It is the context: knowing whether you are taking ERL and heading toward IRL, knowing which kill zone you are trading in, and knowing how the grab fits into the larger quarterly liquidity draw that institutions are working toward.
To go deeper on each layer of this framework, these GhostTraders guides pick up exactly where this article leaves off:
- What Is Liquidity in Trading: the full foundational breakdown of how institutional liquidity works and why price is drawn to specific levels.
- External and Internal Range Liquidity: how to define your range, identify ERL and IRL, and understand the cycle that explains where price is heading after a grab.
- Quarterly Shifts and IPDA Data Ranges: how institutional traders plan liquidity targets across 20-day data windows, and why certain BSL and SSL levels matter far more than others.
- Liquidity-Based Bias: how to use BSL and SSL grabs to set a directional bias and hold it until the market tells you otherwise.
Risk Disclosure: Trading foreign exchange and financial derivatives carries a high level of risk and may not be suitable for all investors. All content on GhostTraders is for educational purposes only and does not constitute financial advice. Never trade with capital you cannot afford to lose. Author: Ndumiso Phelembe, Founder of GhostTraders, with over a decade of experience in institutional trading methodology.
